
Back to Articles
Blood Analysis: How ApoB, hs-CRP, and Insulin Fit Together
Blood analysis guide to ApoB, hs-CRP, and fasting insulin: how they connect, what patterns mean, and which labs to add for clearer cardiometabolic risk.
April 28, 2026
1 min read
Vitals Vault Team
Core Essential Wellness Panel
120+ Biomarkers & a thumbprint of your biological age
Includes the depth of physician-backed labs plus AI-reviewed storytelling so you can act on your physiology with confidence.
- 120+ doctor-curated functional medicine tests
- Personalised Action Plan + AI-reviewed clinical summary
- Upload, track, and securely share past reports
- PhenoAge score to measure your biological age
This article provides an in-depth look at how three critical biomarkers—ApoB, hs-CRP, and fasting insulin—interact to reveal underlying cardiometabolic risks often missed by routine blood tests. Designed for individuals interested in longevity and proactive health management, it explains the physiological connections between lipoprotein particles, inflammation, and insulin resistance in a straightforward way. By understanding these markers together, readers can gain a clearer picture of metabolic health and cardiovascular risk.
Most “routine” blood work is built to catch obvious disease, not to explain why a high-performing 40-year-old feels off, gains stubborn weight, or wants to reduce long-term cardiovascular risk.
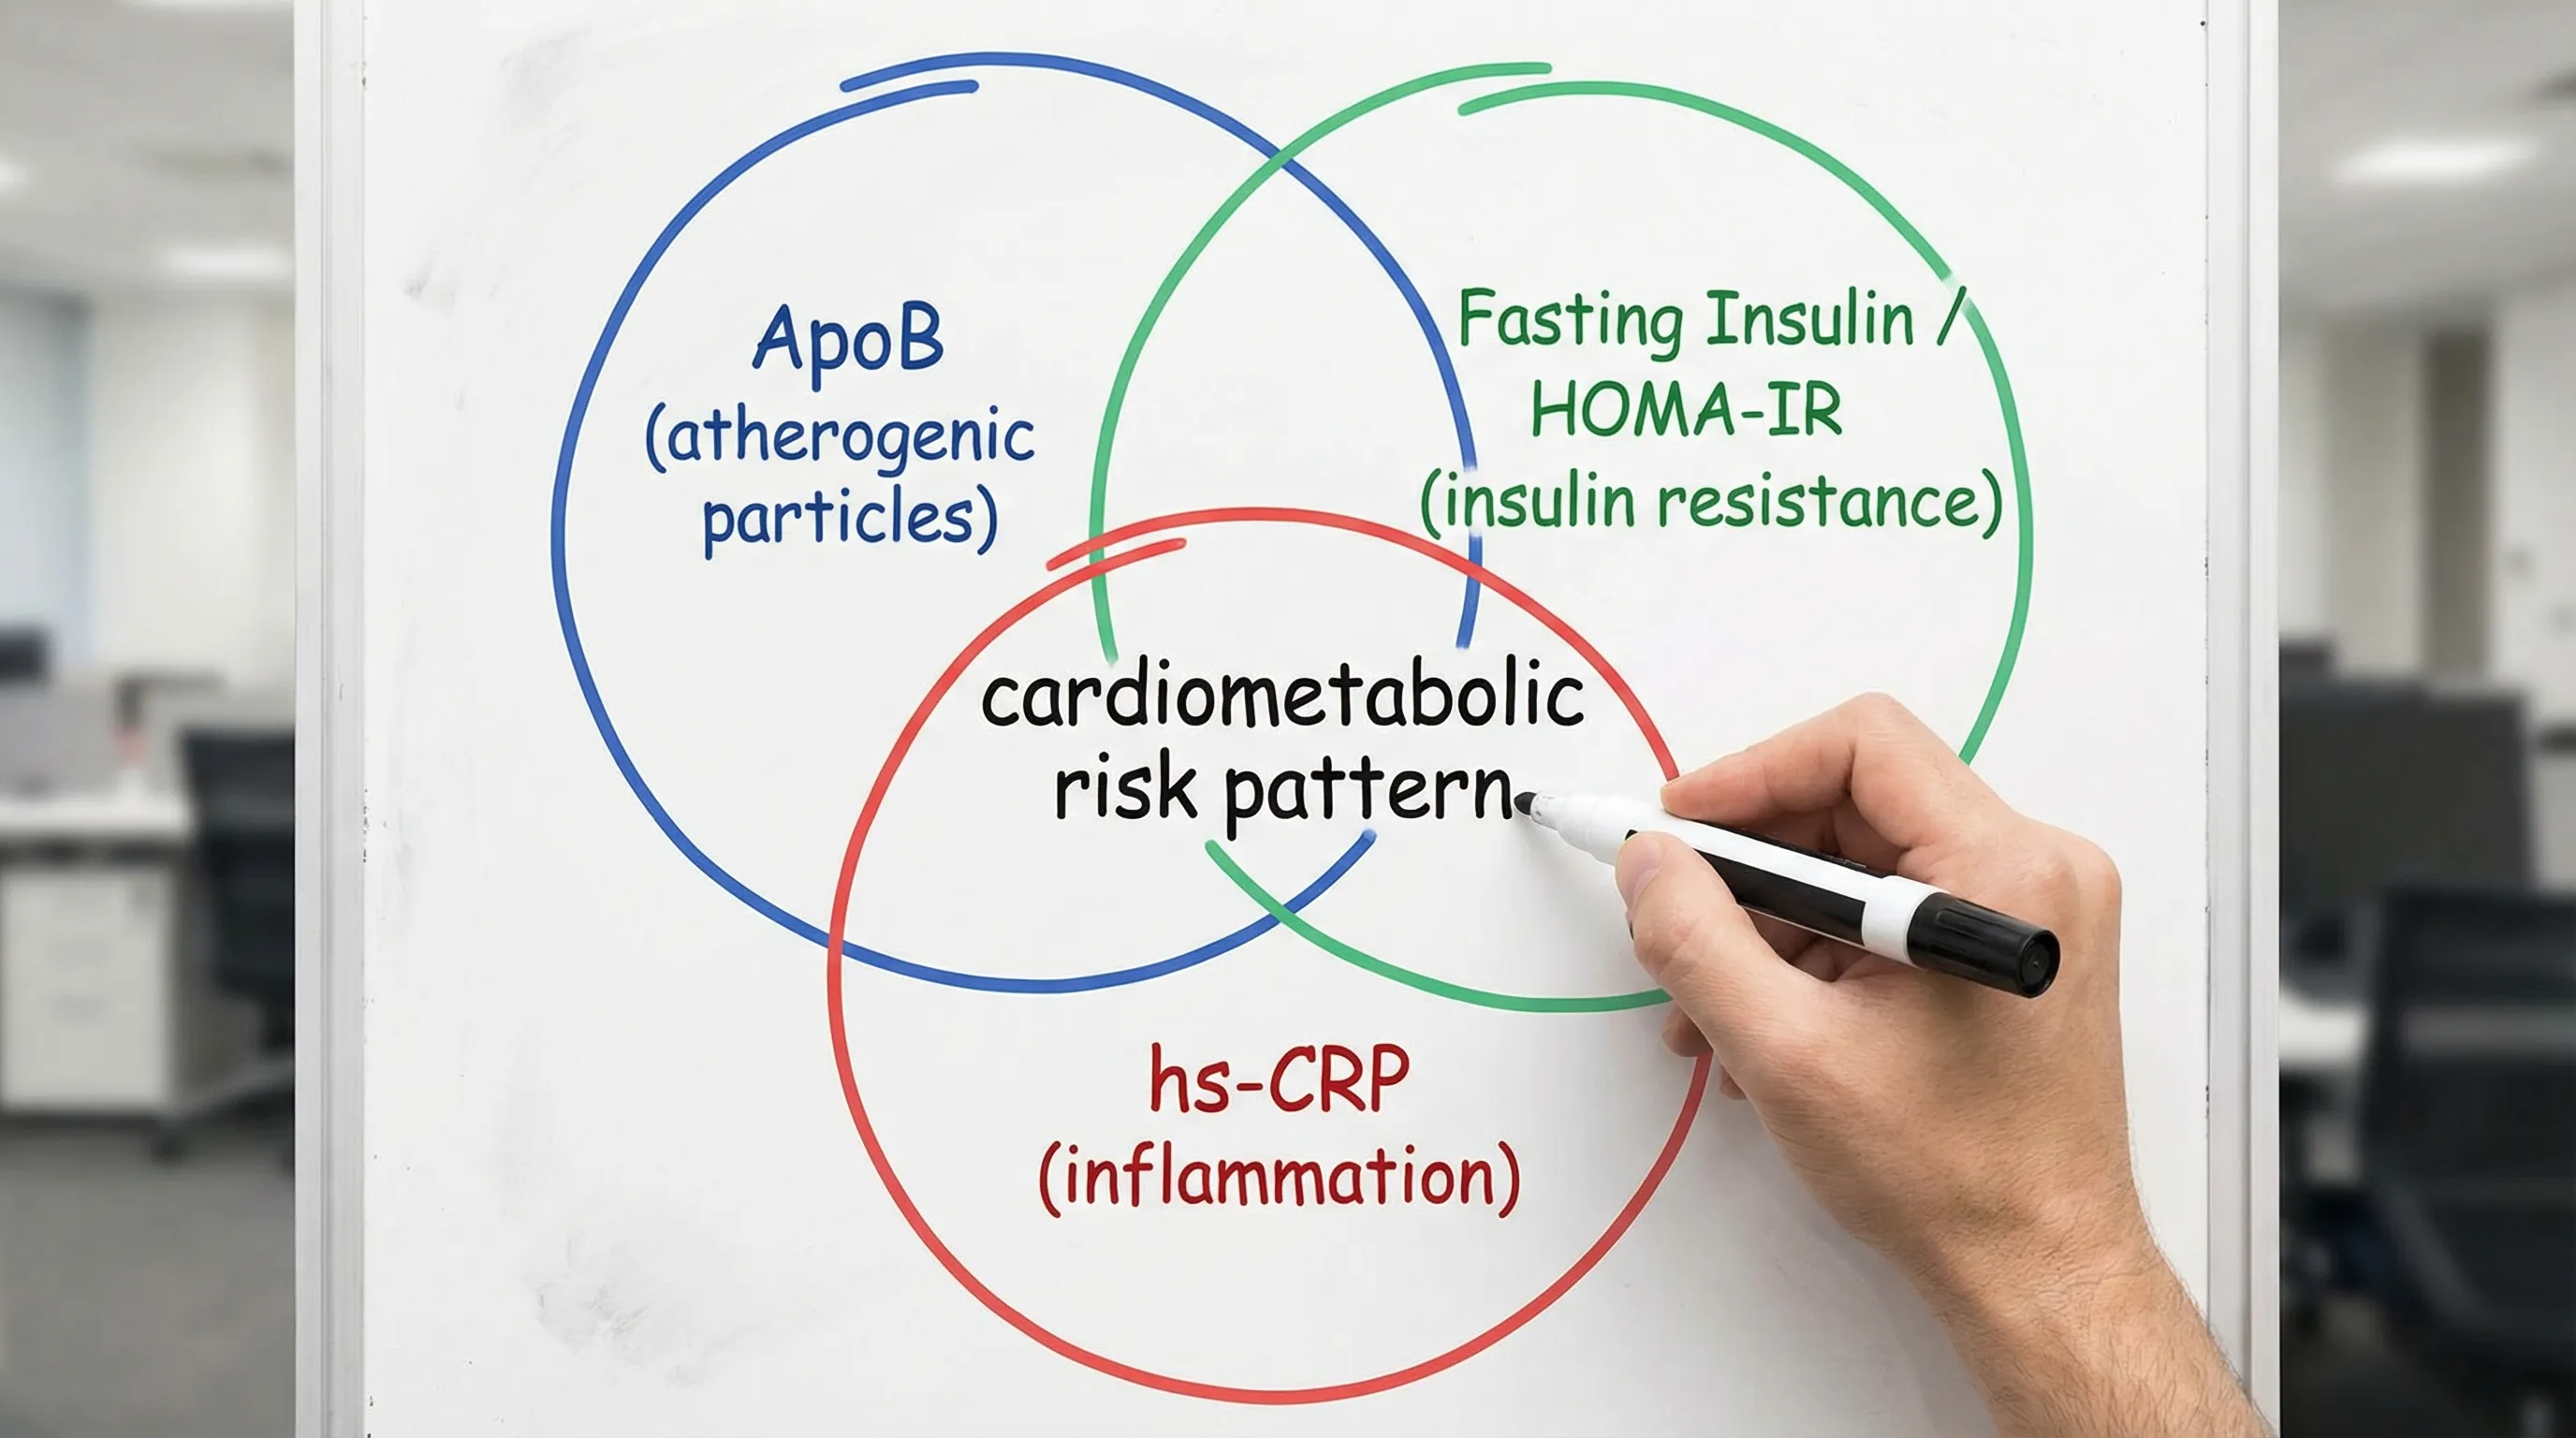
If you want a modern, longevity-focused blood analysis, three markers often tell a more complete story together than any one number alone:
- ApoB (atherogenic particle burden)
- hs-CRP (chronic low-grade inflammation)
- Fasting insulin (plus HOMA-IR) (insulin resistance signal)
When you interpret them as a system, you can often spot the “why” behind borderline lipids, normal glucose, or confusing symptoms.
(Educational only, not medical advice. Always discuss results and decisions with a licensed clinician.)
The “3-signal” model: particles, inflammation, and insulin
Think of ApoB, hs-CRP, and insulin as three connected signals that frequently rise together in the real world:
- ApoB answers: How many artery-entering lipoprotein particles are circulating?
- hs-CRP answers: Is the immune system chronically activated (even subtly)?
- Fasting insulin and HOMA-IR answer: How hard is your pancreas working to keep glucose normal?
Why it matters: insulin resistance can push ApoB up, and inflammation can worsen insulin signaling. Meanwhile, a high ApoB particle load contributes to arterial injury and immune activation over time.
ApoB: the particle count that can outperform “LDL” for risk context
Apolipoprotein B (ApoB) is a protein found on atherogenic particles (including LDL and other ApoB-containing lipoproteins). In practical terms, ApoB works as a count of the particles that can enter the artery wall.
This is why ApoB is so useful in blood analysis:
- LDL-C is cholesterol mass, not particle number.
- You can have “normal LDL-C” but still have too many particles (especially common with insulin resistance and high triglycerides).
Many professional guidelines recognize ApoB as a strong risk marker and a valuable “risk-enhancer” when standard lipids are ambiguous. For context, see the 2018 AHA/ACC cholesterol guideline and the 2019 ESC/EAS dyslipidaemia guideline.
If you want a deeper ApoB primer, Vitals Vault also maintains an ApoB biomarker intelligence page: Apolipoprotein B (ApoB).
ApoB rarely moves alone (watch the “insulin resistance lipid pattern”)
When ApoB rises due to insulin resistance, it often travels with:
- Higher triglycerides
- Lower HDL-C
- Higher non-HDL-C
- “Normal” or only mildly elevated LDL-C (a common trap)
This is one reason a longevity panel that includes ApoB plus insulin markers can be dramatically more actionable than a basic lipid panel.
hs-CRP: inflammation that connects metabolic dysfunction and vascular risk
High-sensitivity C-reactive protein (hs-CRP) is a lab marker that helps quantify low-grade systemic inflammation.
A key point for interpretation: hs-CRP is not specific to one disease. It can rise with infection, injury, intense training, poor sleep, chronic stress, smoking, visceral fat, and cardiometabolic dysfunction.
Clinically, hs-CRP is widely discussed as a cardiovascular risk marker, including in the AHA/CDC scientific statement on inflammatory markers in cardiovascular disease: AHA/CDC statement.
If you want a dedicated deep dive, Vitals Vault has a full biomarker page here: hs-CRP.
The most common hs-CRP mistake: testing at the wrong time
Because hs-CRP is sensitive, your “signal” can get drowned by short-term noise. Consider delaying or standardizing testing if you recently had:
- A cold, flu, or dental infection
- A hard endurance event or heavy lifting session
- An injury or surgery
If hs-CRP is elevated, many clinicians will recheck it after you are back to baseline and symptom-free (timing varies by person and context).
Fasting insulin and HOMA-IR: the early warning system before glucose flags
Fasting glucose and HbA1c matter, but they can stay “normal” for years while insulin is quietly rising.
That is why many proactive longevity clinicians look at:
- Fasting insulin (how much insulin is needed to hold fasting glucose steady)
- HOMA-IR (an index calculated from fasting glucose and fasting insulin)
Insulin resistance is a common upstream driver of:
- Higher triglycerides
- Fatigue and energy swings
- Easier fat gain, harder fat loss
- Elevated blood pressure in some people
- Higher ApoB particle burden
For broader clinical context on screening and metabolic risk, the American Diabetes Association updates its Standards of Care annually (see the ADA Standards of Medical Care).
How ApoB, hs-CRP, and insulin fit together (the physiology in plain English)
Here is the connection most people miss:
1) Insulin resistance can raise ApoB through liver output
When insulin signaling is impaired, the liver often exports more triglyceride-rich lipoproteins (VLDL). As those particles remodel, you can end up with more ApoB-containing particles circulating.
What it looks like in blood analysis:
- Fasting insulin up (or HOMA-IR up)
- Triglycerides up
- HDL down
- ApoB up
2) Inflammation can worsen insulin sensitivity
Chronic low-grade inflammation is strongly associated with impaired insulin signaling. You do not need a dramatic CRP spike for this to matter. Over time, inflammation can make metabolic control harder and can correlate with visceral adiposity, poor sleep, sedentary behavior, and other risk factors.
What it looks like:
- hs-CRP up
- Insulin up (sometimes before glucose rises)
- Often, lipids trend worse (especially triglycerides)
3) Particle burden and inflammation reinforce each other
ApoB particles are central to atherosclerosis biology, and inflammatory signaling is involved in plaque development and instability. That does not mean one lab “diagnoses plaque,” but it does mean ApoB and hs-CRP together provide more context than either alone.
A practical pattern table (what the trio often means together)
Use this as a discussion guide for your next lab review, not as a diagnostic tool.
Swipe
What to include in a smarter cardiometabolic blood panel (beyond basics)
If your goal is to understand how ApoB, hs-CRP, and insulin fit together, you usually want companion markers that remove ambiguity.
Core add-ons that improve interpretation
- ApoB
- hs-CRP
- Fasting insulin and fasting glucose (for HOMA-IR)
- HbA1c (longer-term glucose exposure)
- Triglycerides, HDL-C, LDL-C, non-HDL-C
High-leverage “why is this happening?” add-ons
- Lp(a) (genetic risk enhancer that can raise risk independent of LDL-C)
- Homocysteine (vascular and nutrient-linked risk context)
- ALT and GGT (liver stress context, often relevant in metabolic dysfunction)
- Urine albumin-to-creatinine ratio (kidney and vascular health context)
Vitals Vault maintains biomarker explainers you can use to go deeper, including Lp(a) and Homocysteine.
Retesting cadence: when trends become actionable
One-off labs are a snapshot. For optimization, trends are usually what change decisions.
A practical cadence many clinicians use (individualized by goals, baseline risk, and interventions):
- 8 to 12 weeks after a meaningful lifestyle change or medication change to confirm direction
- Every 3 to 6 months during active optimization
- Yearly once stable (or sooner if values are changing)
Standardize your draws when possible (fasting window, time of day, training load, alcohol, and illness status) so you are measuring physiology, not noise.
“My doctor won’t order these tests” (and the referral loop problem)
A common pain point for health-conscious professionals is getting dismissed with “your labs are normal,” even when symptoms persist or family history is concerning.
If you want comprehensive blood analysis without the friction:
- No doctor referral needed through Vitals Vault
- Results in 24 to 48 hours for many common labs (timing varies by test and lab processing)
- Lab draws available nationwide at 2,000+ Quest/Labcorp locations
You can explore the biomarker library first at Vitals Vault Biomarkers, then choose a panel when you are ready.
Vitals Vault vs Function Health, InsideTracker, Superpower, and Mito Health
If you are comparing platforms, the most important question is not “which app looks nicest,” it is whether you get enough biomarkers, fast turnaround, and clinician-level interpretation to act with confidence.
Vitals Vault is positioned as the comprehensive, affordable alternative, with more biomarkers, lower cost, no waitlist, and clinician access included.
Swipe
For detailed head-to-head breakdowns, see:
Frequently Asked Questions
What is blood analysis trying to answer with ApoB, hs-CRP, and insulin? It is trying to connect three upstream drivers of long-term cardiometabolic risk: atherogenic particle burden (ApoB), inflammatory tone (hs-CRP), and metabolic stress (fasting insulin and HOMA-IR).
Is ApoB better than LDL-C? They measure different things. LDL-C measures cholesterol carried inside particles, while ApoB approximates the number of atherogenic particles. Many clinicians use ApoB when LDL-C does not match the rest of the metabolic picture.
Can hs-CRP be high for reasons that have nothing to do with heart health? Yes. Recent infections, dental issues, injury, intense workouts, and other inflammatory triggers can elevate hs-CRP. That is why context and retesting under standardized conditions matter.
What is HOMA-IR and do I need it if I have fasting insulin? HOMA-IR is a calculated index derived from fasting glucose and fasting insulin. Some clinicians find it easier to interpret as a single “insulin resistance signal,” but fasting insulin and glucose trends are still the foundation.
What other labs should I pair with ApoB, hs-CRP, and insulin? Common companion markers include triglycerides, HDL-C, non-HDL-C, HbA1c, Lp(a), homocysteine, ALT, and GGT. The best add-ons depend on your history and goals.
Get a full ApoB, hs-CRP, and insulin picture (without a referral)
If you are ready to stop piecing together partial labs, Vitals Vault lets you order comprehensive panels that include the markers that actually connect the dots.
- 100 to 160+ biomarkers in one coordinated program
- No doctor referral needed
- Results in 24 to 48 hours for many tests
- Clinician-reviewed insights, plus longitudinal tracking
Explore what each marker means: Browse the biomarker library
Order your panel now: Go to checkout
Conclusion
Understanding the interplay between ApoB, hs-CRP, and fasting insulin offers a more comprehensive perspective on cardiometabolic health than isolated lab values. These markers collectively reveal the complex relationships between particle burden, inflammation, and insulin resistance, providing valuable context for personalized blood analysis. Regular monitoring and a broader panel of companion tests can help track changes and support informed health decisions.