
Back to Articles
How to Read Lab Results: Optimal Ranges vs Reference Ranges
How to read lab results by comparing reference ranges vs optimal ranges, with key examples (ApoB, hs-CRP, insulin) and next steps to act.
Blood Test Interpretation
March 9, 2026
1 min read
Vitals Vault Team
Core Essential Wellness Panel
100+ Biomarkers & a thumbprint of your biological age
Includes the depth of physician-backed labs plus AI-reviewed storytelling so you can act on your physiology with confidence.
- 100+ doctor-curated functional medicine tests
- Personalised Action Plan + AI-reviewed clinical summary
- Upload, track, and securely share past reports
- PhenoAge score to measure your biological age
Understanding your lab results can be confusing, especially when normal reference ranges don't align with how you feel. This guide on how to read lab results explains the important distinction between standard reference ranges and optimal ranges, focusing on what these numbers mean for your health, performance, and longevity. It's designed for anyone looking to interpret lab data more effectively and make informed decisions based on their individual context.
If you have ever opened a lab report and thought, “It says normal, so why do I still feel off?” you are not alone. Most people are shown a reference range and a flag (H or L) and left to interpret the rest with little context. But reference ranges are not the same thing as optimal ranges, especially if your goal is performance, prevention, and longevity.
This guide breaks down how to read lab results with a practical, clinician-style lens, so you can understand what “normal” really means, when “optimal” targets are useful, and how to decide what to do next.
Educational content only, not medical advice. If you have severe symptoms or a critical lab value, seek urgent care.
What is a reference range on a lab report?
A reference range (sometimes called a “normal range”) is typically the interval that captures the middle 95% of results from a lab’s reference population, often set between the 2.5th and 97.5th percentiles. In other words, it is a statistical description of what is common in that population, not necessarily what is ideal for your goals.
A few reasons reference ranges can mislead smart, proactive people:
- They depend on who was used to build the range. Age, sex, ethnicity, and underlying health of the reference group all matter.
- They vary by lab and method. A result can shift simply because the assay, instrument, or reference interval differs.
- They are designed for clinical screening, not optimization. Many “normal” results are compatible with early insulin resistance, chronic low-grade inflammation, or suboptimal nutrient status.
For a technical overview of how reference intervals are established, see the CLSI EP28 guidance (the standard many labs follow) and an accessible summary from the American Association for Clinical Chemistry (AACC).
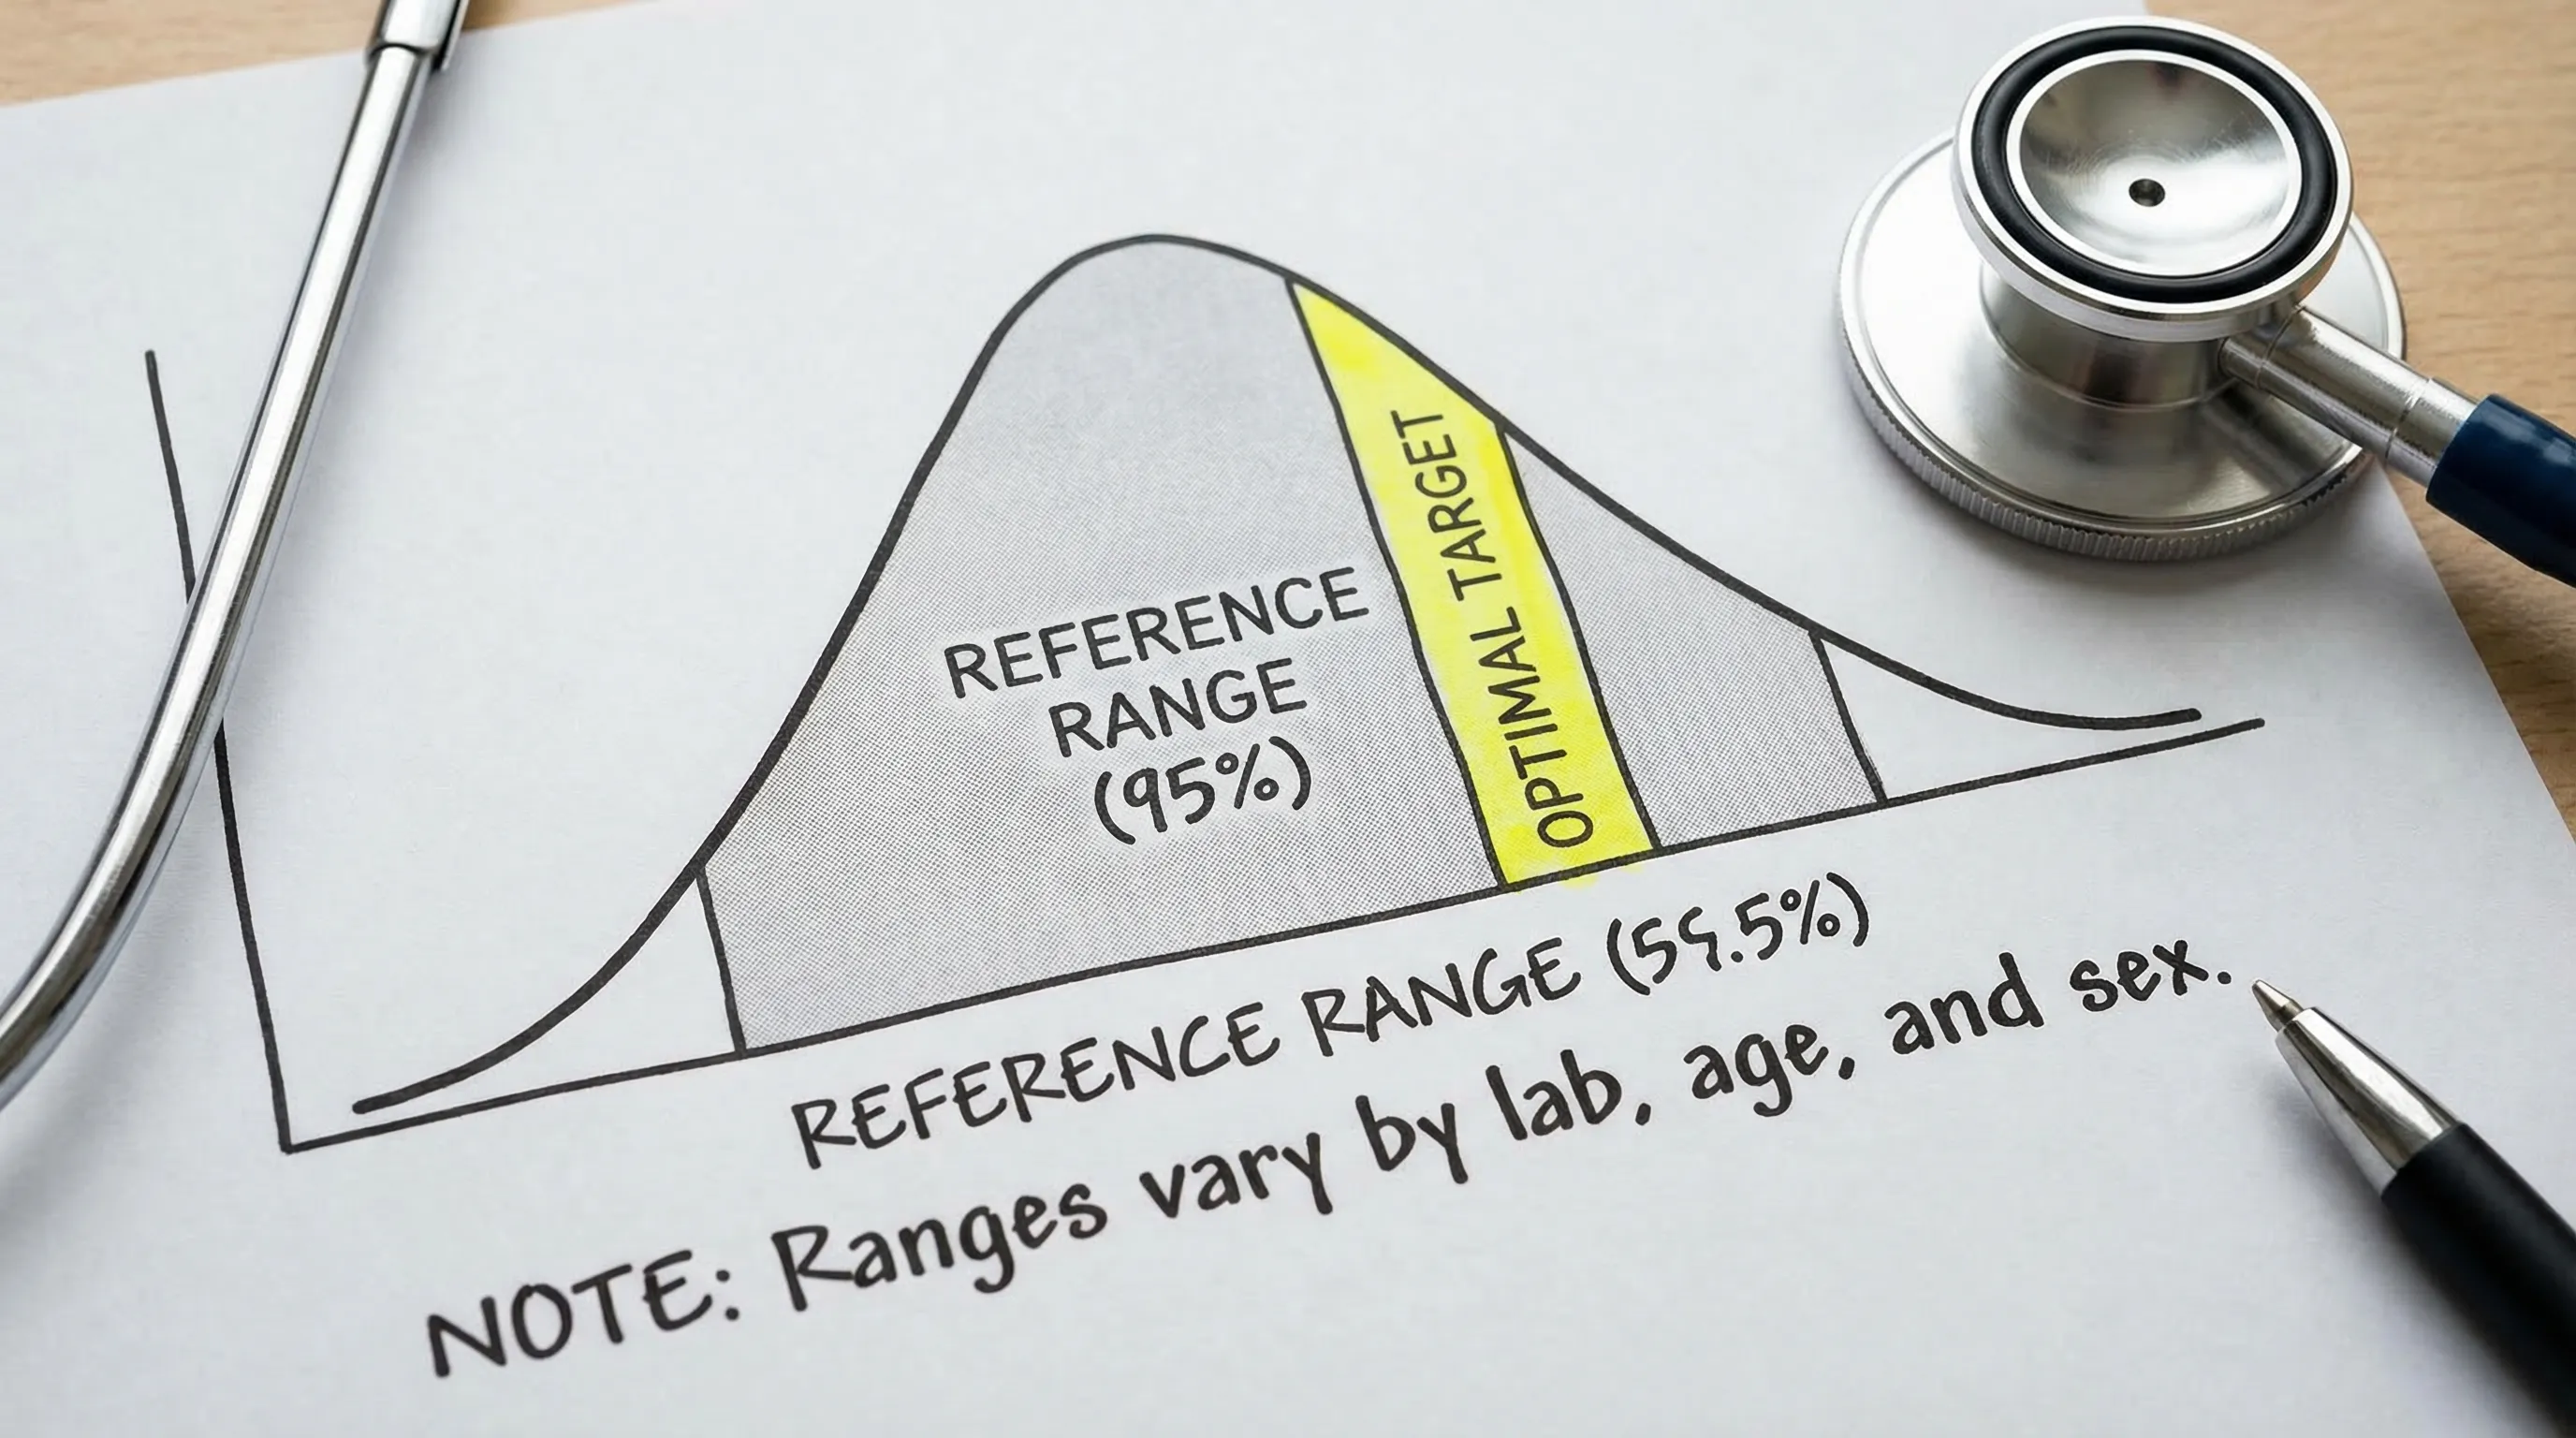
What is an optimal range (and who decides it)?
An optimal range is a narrower target band that is often used in preventive, functional, and longevity-focused care. It is usually based on a mix of:
- Risk associations from epidemiology (for example, cardiometabolic risk)
- Clinical guidelines for specific populations
- Mechanistic physiology (how systems behave when functioning well)
- Longitudinal tracking (your baseline and trend)
Important nuance: “Optimal” is context-dependent. A target that makes sense for a 35-year-old trying to maximize metabolic flexibility may not match the best target for a 75-year-old with chronic disease or someone on specific medications.
Why can “normal” still be a problem?
Because “normal” often means “not obviously alarming for the average person,” not “low-risk for the next 10 to 30 years.” Three common scenarios where “normal” can still be actionable:
Normal-but-trending-worse
If your fasting insulin, ApoB, ALT, or hs-CRP has moved steadily in the wrong direction over 12 to 24 months, that pattern can matter more than whether today’s number is flagged.
Normal in isolation, abnormal in a pattern
Many high-signal insights come from clusters of biomarkers, not one value:
- Insulin resistance pattern: fasting insulin + fasting glucose + HOMA-IR (or QUICKI) + triglycerides/HDL-C
- Atherogenic risk pattern: ApoB + LDL-C + non-HDL-C + Lp(a)
- Inflammation pattern: hs-CRP + ferritin (context-dependent) + CBC differentials
Normal for acute care, not optimal for longevity
Some markers have reference ranges designed to catch disease states, while optimal targets aim to reduce risk earlier.
A classic example is hs-CRP: many clinicians use cardiovascular risk cut points published with the CDC and AHA consensus framework (low risk <1 mg/L, average 1 to 3, high >3). You can read a plain-language explanation on Testing.com’s hs-CRP overview.
How do I read lab results step by step (without overreacting)?
Use this simple workflow to stay calm, accurate, and data-driven.
Step 1: Confirm the basics on the report
Before interpreting physiology, confirm:
- Units (mg/dL vs mmol/L, ng/mL vs nmol/L)
- Reference range shown on that specific report
- Whether the test was fasting, time-of-day sensitive (testosterone, cortisol), or affected by the menstrual cycle
Step 2: Ask, “Could this be noise?”
A surprising number of outliers are pre-analytic.
Common confounders that can shift results:
- Dehydration (can raise albumin, hematocrit, BUN/creatinine ratio)
- Hard training 24 to 72 hours pre-draw (can alter CK, AST/ALT, inflammation markers)
- Recent infection, poor sleep, alcohol, or a new supplement
If the number is mildly off and you have an obvious confounder, a standardized retest is often smarter than a spiral.
Step 3: Separate “urgent,” “follow-up soon,” and “optimize”
Lab flags are not urgency labels.
- Urgent: critical values, severe symptoms, or results your lab marks as critical (call a clinician or urgent care)
- Follow-up soon: clearly abnormal patterns (for example, kidney filtration signals like rising creatinine with falling eGFR)
- Optimize: normal-but-not-ideal values that match your goals (for example, higher-than-desired fasting insulin)
Step 4: Interpret by systems, not by single markers
You will make fewer mistakes when you group labs:
- Cardiometabolic: fasting insulin, glucose, HOMA-IR, HbA1c, triglycerides, HDL-C
- Atherogenic risk: ApoB, LDL-C, non-HDL-C, Lp(a)
- Inflammation: hs-CRP, ferritin (context), CBC differentials
- Liver: ALT, AST, GGT, bilirubin
- Kidney: creatinine, eGFR, urine albumin-to-creatinine ratio
- Hormones: TSH, Free T4, Free T3, testosterone, estradiol, cortisol
- Nutrients: vitamin D (25-OH), vitamin B12, folate, iron studies, magnesium (method matters)
Step 5: Use companion biomarkers to avoid false conclusions
A few high-value pairings:
- ApoB with LDL-C: LDL-C can look “fine” while ApoB reveals high particle number.
- Fasting insulin with glucose (and HOMA-IR): glucose can stay normal for years while insulin rises.
- Ferritin with hs-CRP: ferritin can rise from inflammation, not just iron overload.
- Creatinine with eGFR: creatinine depends on muscle mass, supplements (creatine), and hydration.
Step 6: Decide the next action
Your next step should be one of these, not all of them:
- Standardize and retest
- Add 1 to 3 companion markers
- Implement a focused lifestyle protocol for 8 to 12 weeks, then retest
- Escalate to a clinician if the pattern suggests disease, not optimization
Step 7: Track trends and build your personal baseline
For longevity-focused testing, your “best” lab result is not a single perfect draw. It is a reliable baseline and a trend line.
If you want a systematic way to do this with clinician oversight, you can explore the Vitals Vault biomarker library at Vitals Vault /biomarkers and order a comprehensive panel at Vitals Vault /checkout.
Which biomarkers most often look “normal” but are not optimal?
Below are common examples where proactive people benefit from optimal targets and pattern-reading.
Swipe
If you want to go deeper on specific markers, Vitals Vault has dedicated explainers for many of these, including ApoB and hs-CRP.
How do optimal ranges differ from reference ranges in real life?
Think of it this way:
- Reference range: “Are you far outside what is common in the general population?”
- Optimal range: “Are you in a zone associated with better metabolic resilience, lower inflammation, and lower long-term risk, given your context?”
Here is a practical way to translate that into decisions.
Swipe
What are the most common mistakes when people try to “optimize” labs?
Mistake 1: Treating a single value as a diagnosis
Lab tests are inputs, not conclusions. Symptoms, meds, history, and other biomarkers matter.
Mistake 2: Ignoring method and timing
Examples:
- Testosterone and cortisol are time-sensitive.
- Some nutrients and hormones vary across the day or menstrual cycle.
- Different assays can produce different numbers.
Mistake 3: Optimizing the wrong thing
If you chase LDL-C without looking at ApoB, you can miss particle-driven risk. If you chase ferritin without checking hs-CRP, you can misread inflammation as “iron overload.”
Mistake 4: Not testing deeply enough
Many “basic” panels are missing the markers that clarify patterns, such as ApoB, Lp(a), hs-CRP, fasting insulin, and full thyroid and sex hormone panels.
How can I get comprehensive labs and clinician-reviewed interpretation without a doctor?
If you have been dismissed, stuck in insurance friction, or told “we only test that if something is wrong,” you are exactly the person direct-access biomarker testing was built for.
With Vitals Vault, you can order comprehensive panels covering 100 to 160+ biomarkers, draw at 2,000+ Quest/Labcorp locations nationwide, and get clinician-reviewed insights without waiting for referrals. There is no doctor referral needed, and many results return in 24 to 48 hours.
- Explore what is included: Vitals Vault biomarker catalog
- Ready to test: Go to checkout
Which service is best if I care about optimal ranges and biomarker depth?
If you are comparing platforms like Function Health, InsideTracker, Superpower, or Mito Health, focus on what actually affects your ability to interpret and act:
- Biomarker depth (do you get ApoB, Lp(a), fasting insulin, hs-CRP, full hormones, nutrients?)
- Wait time (can you test now, or are you in a queue?)
- Clinician access (is interpretation included, or mostly app coaching?)
- Cost per biomarker (value, not marketing)
Vitals Vault is positioned as the comprehensive, affordable alternative, with more biomarkers at a lower price, no waitlist, and clinician access included.
Swipe
If your primary frustration is “I can get labs, but I cannot get answers,” a deeper panel plus clinician review usually beats a minimalist panel with generic tips.
When should I retest to see if I’m moving toward optimal?
Retesting cadence depends on how fast the biomarker changes and whether you changed anything meaningful.
As a general rule:
- Fast-moving markers (some lipids, hs-CRP, fasting insulin) often show movement over 8 to 12 weeks with consistent interventions.
- Slower markers (HbA1c, some hormones depending on cause) may need 12+ weeks.
- Genetic markers like Lp(a) usually do not need frequent retesting unless your clinician recommends it.
If you want to optimize efficiently, testing too often can create noise, but testing too rarely creates guesswork.
The simplest way to start reading labs like a longevity-focused clinician
If you only remember one thing, remember this:
Reference ranges help detect disease. Optimal ranges help reduce risk and improve performance, but only when interpreted in context and tracked over time.
If you want to skip piecemeal testing and get a systems-level panel (ApoB, Lp(a), hs-CRP, fasting insulin, HOMA-IR, hormones, nutrients, liver and kidney markers) with clinician-reviewed interpretation, start here:
- Browse markers: Vitals Vault biomarker library
- Order your panel: Vitals Vault checkout
Vitals Vault is HSA/FSA eligible nationwide, requires no doctor referral, and delivers many results in 24 to 48 hours, so you can move from “normal” to truly informed, faster.
Conclusion
Interpreting lab results through the lens of optimal ranges rather than just reference ranges allows for a more proactive approach to health. By considering trends, patterns, and context, you can better assess risk and guide your next steps thoughtfully. Tracking your personal baseline over time and using companion biomarkers can greatly enhance the value of lab testing for long-term wellbeing.