
Back to Articles
Reading Blood Test Results: A Simple Step-by-Step Guide
Reading blood test results made simple: learn report basics, common panels, what high or low flags mean, and when to retest or ask a clinician.
April 28, 2026
1 min read
Vitals Vault Team
Core Essential Wellness Panel
120+ Biomarkers & a thumbprint of your biological age
Includes the depth of physician-backed labs plus AI-reviewed storytelling so you can act on your physiology with confidence.
- 120+ doctor-curated functional medicine tests
- Personalised Action Plan + AI-reviewed clinical summary
- Upload, track, and securely share past reports
- PhenoAge score to measure your biological age
Most lab reports are designed for clinicians, not humans with busy lives. The good news is that reading blood test results becomes straightforward once you know (1) how the report is structured and (2) how to interpret patterns instead of obsessing over a single flagged number.
Most lab reports are designed for clinicians, not humans with busy lives. The good news is that reading blood test results becomes straightforward once you know (1) how the report is structured and (2) how to interpret patterns instead of obsessing over a single flagged number.
This guide walks you through a practical, step-by-step method you can use on any lab report, plus common “next steps” when something looks off.
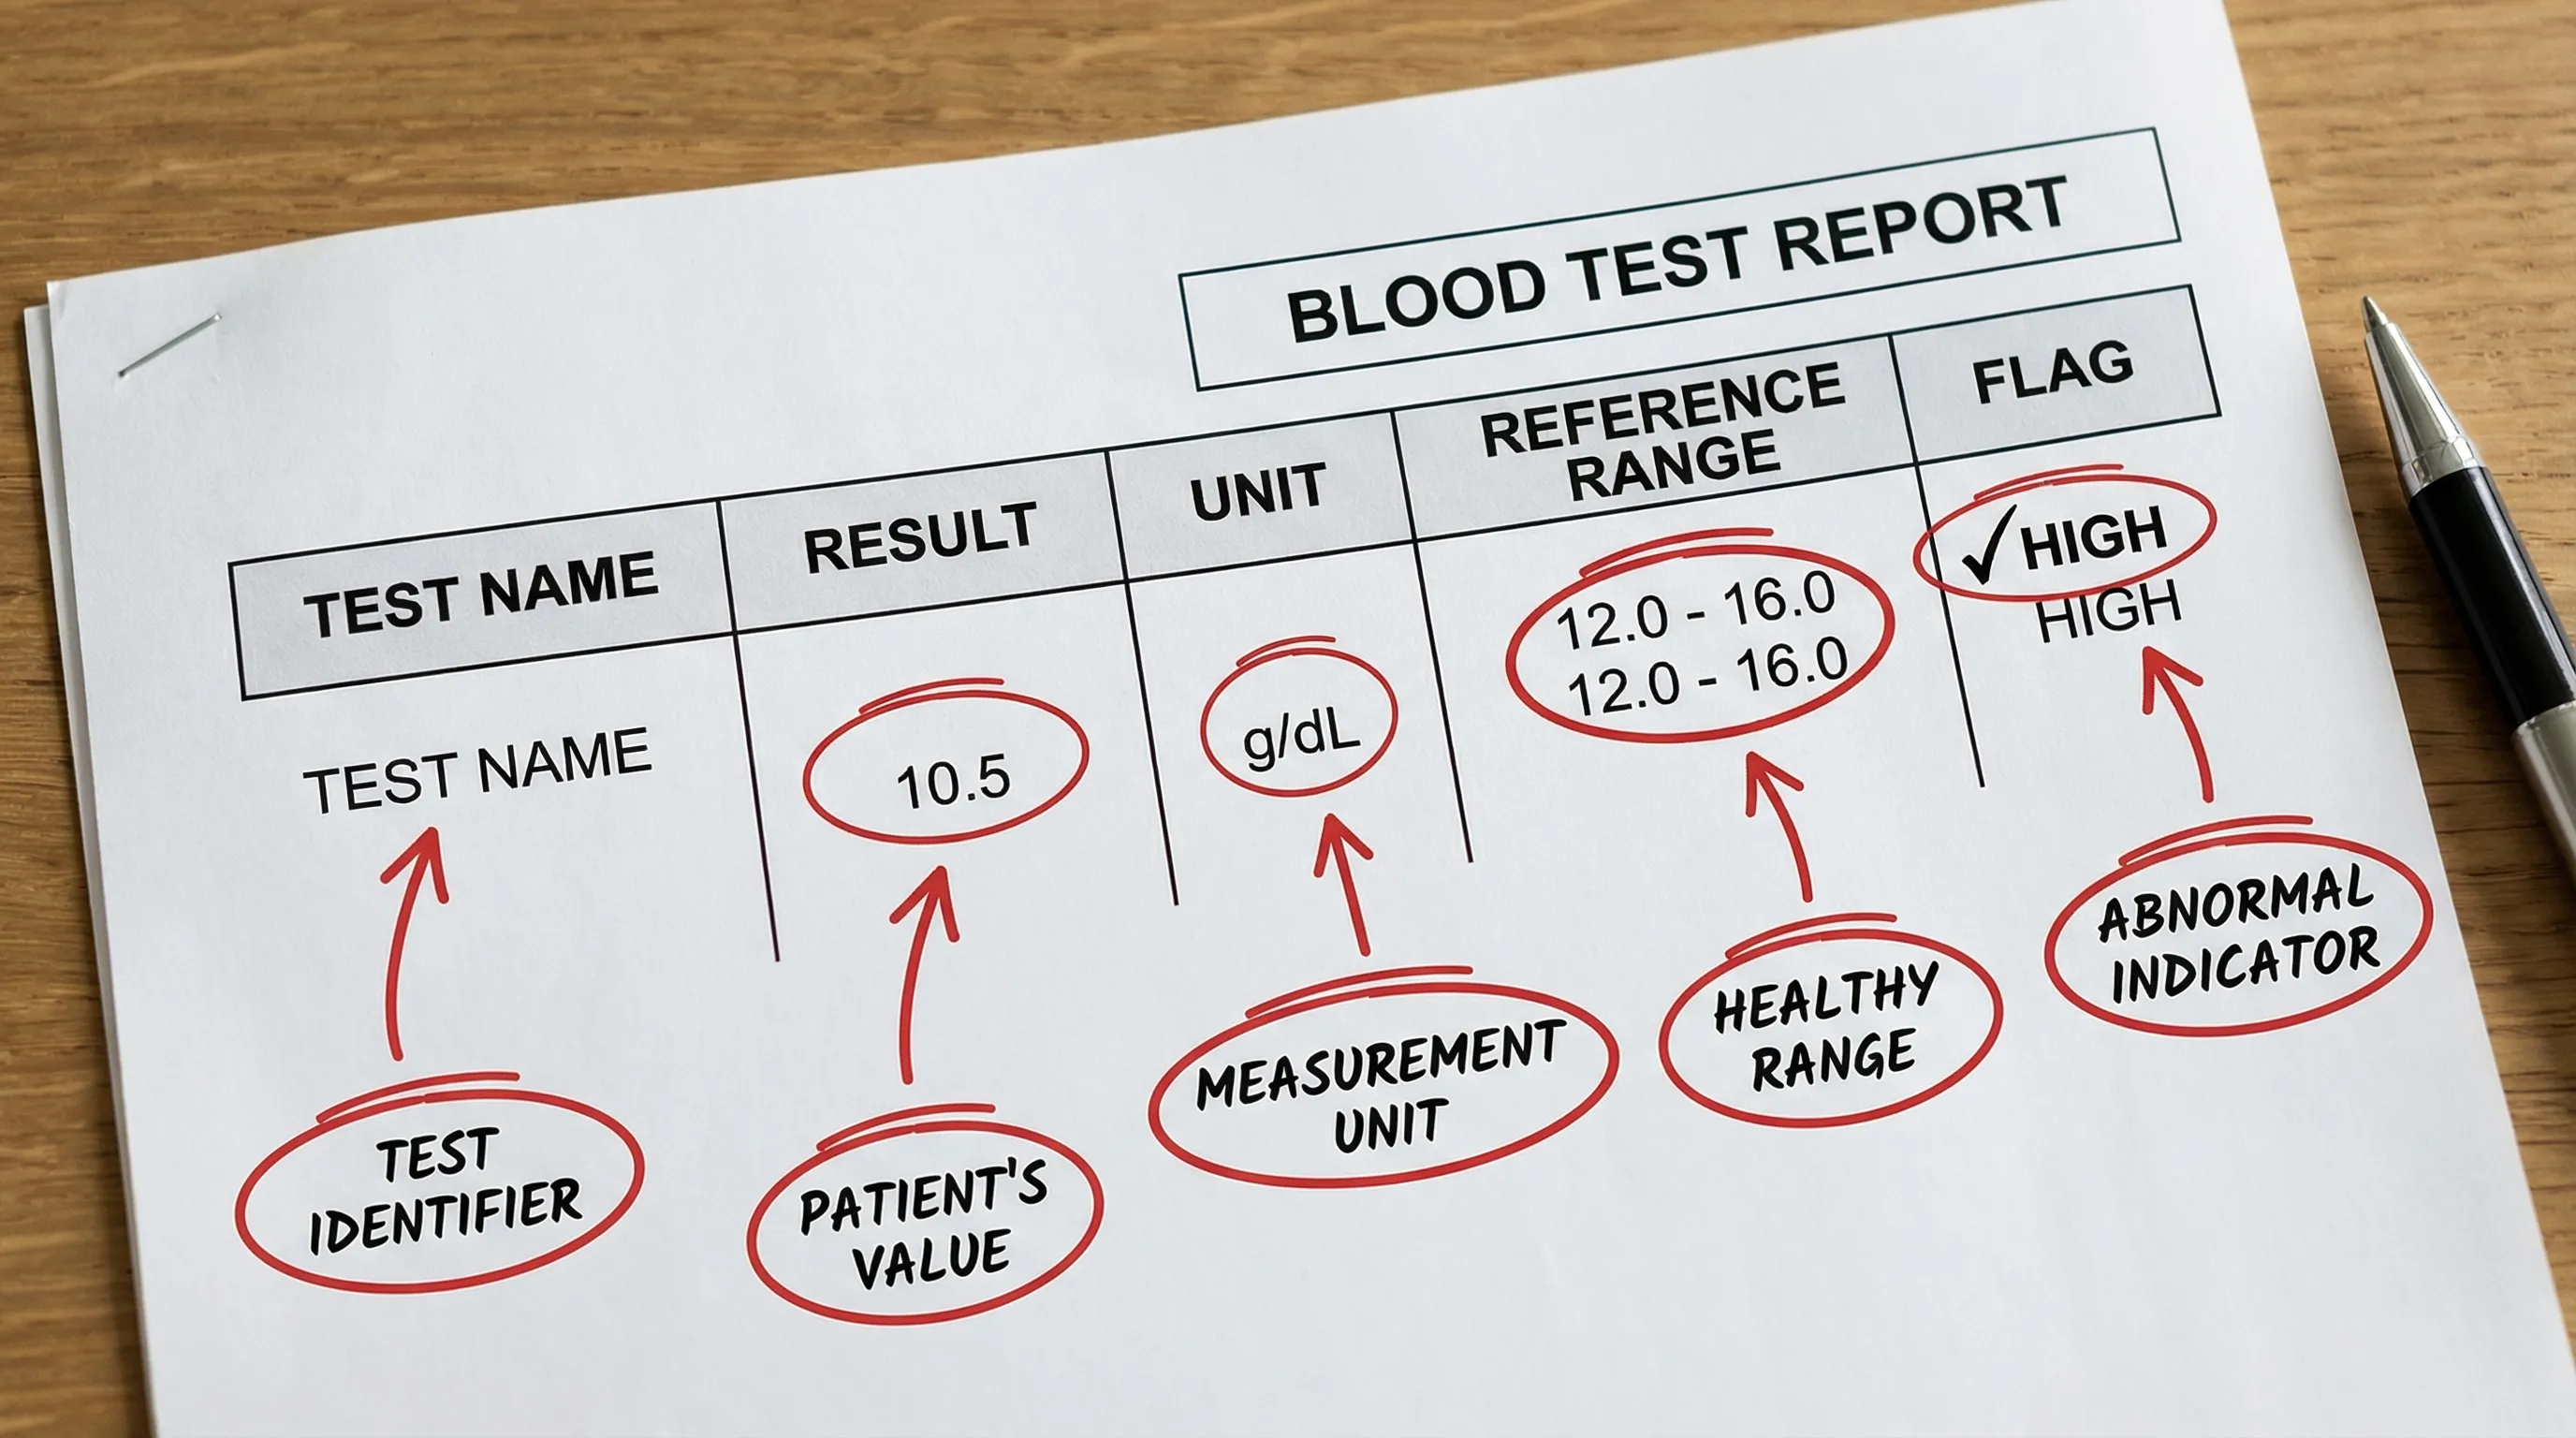
Step 0: Understand what’s on the page (the lab report anatomy)
Before interpreting anything, orient yourself. Most blood test reports include:
- Test name (example: Creatinine, AST, Ferritin)
- Your result
- Units (mg/dL, mmol/L, U/L, ng/mL, etc.)
- Reference range (what the lab considers “normal” for their population and method)
- Flags (H, L, or color coding for high/low)
- Comments (sometimes notes about method, fasting status, or specimen issues)
Two important nuances:
- Reference ranges are not the same as optimal ranges. A reference range is usually derived from a broad population that includes many people with early disease. “In range” does not automatically mean “ideal for your goals.”
- Units matter. Cholesterol, glucose, and hormones can appear in different units depending on the lab, and that changes how you compare numbers across reports.
Step 1: Confirm the testing context (it changes results)
A lab value is a snapshot taken under specific conditions. If you skip this step, you can misread perfectly explainable changes as “problems.”
Check these items on the report (or in your notes):
- Fasting vs non-fasting (often impacts glucose and triglycerides)
- Time of day (especially hormones like cortisol)
- Recent exercise (can influence markers related to muscle and inflammation)
- Alcohol intake in the prior 24 to 72 hours (can shift liver enzymes)
- Hydration status (affects several “concentration” markers)
- Recent illness, infection, or allergies flare (can affect white blood cells and inflammation)
- Medications and supplements (common confounders)
If your result is surprising, the first question is often: “Was anything different this week?”
For a trustworthy overview of common lab test basics and what can affect results, see MedlinePlus’ lab tests guide.
Step 2: Think in patterns, not single numbers
When people learn to read their own labs, the biggest upgrade is moving from “one marker panic” to pattern recognition.
Here are a few useful patterns to look for before you dive into each panel:
- Dehydration or concentration pattern: multiple markers look a bit elevated together (for example, albumin and sodium) rather than one isolated spike.
- Inflammation pattern: inflammation markers plus changes in immune cells (for example, hs-CRP with a shift in white blood cell differential).
- Cardiometabolic pattern: lipids plus markers that can reflect liver workload and insulin resistance risk.
- Iron and red blood cell pattern: ferritin, iron saturation, hemoglobin/hematocrit, and RBC indices move together.
This is also where tracking over time becomes powerful. One borderline result may not matter. A consistent trend often does.
Step 3: Read the report one panel at a time
Many “comprehensive” lab panels contain several mini-panels. Here’s how to interpret the most common ones in a simple sequence.
3A) CBC (Complete Blood Count)
A CBC is your high-level view of oxygen-carrying capacity, immune status, and clotting-related components.
Focus areas:
- Hemoglobin and hematocrit: reflect oxygen-carrying capacity and red blood cell concentration.
- MCV and RDW: help characterize red blood cell size and variability, useful for anemia pattern recognition.
- White blood cells (WBC) and differential: provides a snapshot of immune activity.
- Platelets and MPV: relate to clotting and platelet size/activity.
If you want deeper context on a few common CBC markers, Vitals Vault has dedicated guides for:
What “flagged” often means in real life: mild abnormalities on a CBC are commonly driven by iron status, B12/folate status, inflammation, hydration, sleep, training load, or recent illness. That does not mean you ignore them, it means you interpret them with context.
3B) CMP (Comprehensive Metabolic Panel) and electrolytes
This section often includes electrolytes, kidney-related markers, liver enzymes, proteins, and acid-base balance.
Useful groupings:
- Electrolytes: sodium, potassium, chloride, bicarbonate (often shown as CO2).
- Kidney filtration and hydration-related markers: creatinine (plus eGFR on many reports), sometimes BUN.
- Liver enzymes: AST, ALT, GGT.
- Proteins: albumin, globulin, total protein.
Instead of interpreting each value in isolation, compare related markers:
- If creatinine is high-ish but you also had hard training, higher muscle mass, or dehydration, you may need a recheck under standardized conditions.
- If AST is elevated but ALT is normal, training-related muscle stress is one possible contributor (context matters).
- If GGT is elevated, it can be a more sensitive signal of liver workload and oxidative stress, especially alongside other metabolic risk markers.
Vitals Vault references you may find helpful:
3C) Lipids and cardiovascular risk markers
A standard lipid panel usually includes:
- Total cholesterol
- LDL-C
- HDL-C
- Triglycerides
More advanced risk assessment may include:
- Apolipoprotein B (ApoB): reflects the number of atherogenic particles.
- Lipoprotein(a): largely genetic, associated with higher lifetime cardiovascular risk.
Two practical interpretation tips:
- Look at the whole risk picture. Lipids are best read alongside inflammation markers, blood pressure, glucose/insulin markers, family history, and lifestyle context.
- Be consistent with testing conditions. Triglycerides can vary meaningfully based on recent meals and alcohol.
Vitals Vault lipid-related deep dives:
3D) Iron status (one of the most misread sections)
Iron labs are frequently misunderstood because “iron” is not one number.
A more complete view often includes:
- Ferritin (storage)
- Serum iron (circulating)
- Transferrin saturation (iron saturation %) (how much transport capacity is filled)
Interpretation depends heavily on the full pattern and inflammation status. For example, ferritin can rise with inflammation even when functional iron availability is not high.
Vitals Vault references:
3E) Inflammation and “how inflamed am I?” markers
A widely used marker for low-grade inflammation is high-sensitivity CRP (hs-CRP).
- A single hs-CRP reading can be temporarily elevated due to a cold, a dental issue, a tough training week, or poor sleep.
- A persistent elevation across repeat tests is more meaningful, especially when paired with cardiometabolic markers.
Vitals Vault reference:
For clinical background on CRP testing, see the Cleveland Clinic overview.
3F) Urinalysis (often overlooked, very actionable)
Urine markers can add early clues about kidney filtration, urinary tract inflammation, hydration, and metabolic state.
Common urinalysis elements include:
- Protein, blood, ketones, nitrite
- Microscopic red and white blood cells
- Albumin-to-creatinine ratio (a kidney and cardiovascular risk signal)
Vitals Vault references:
Step 4: Convert a flagged result into a sensible next step
A flag is not a diagnosis. It’s a prompt to ask: “Is this (1) transient, (2) a lab artifact, (3) a lifestyle signal, or (4) something that needs medical workup?”
Use this decision table as a practical starting point.
Swipe
If you are unsure whether a value is “mildly off” or “needs attention now,” don’t guess. Reach out to a clinician.
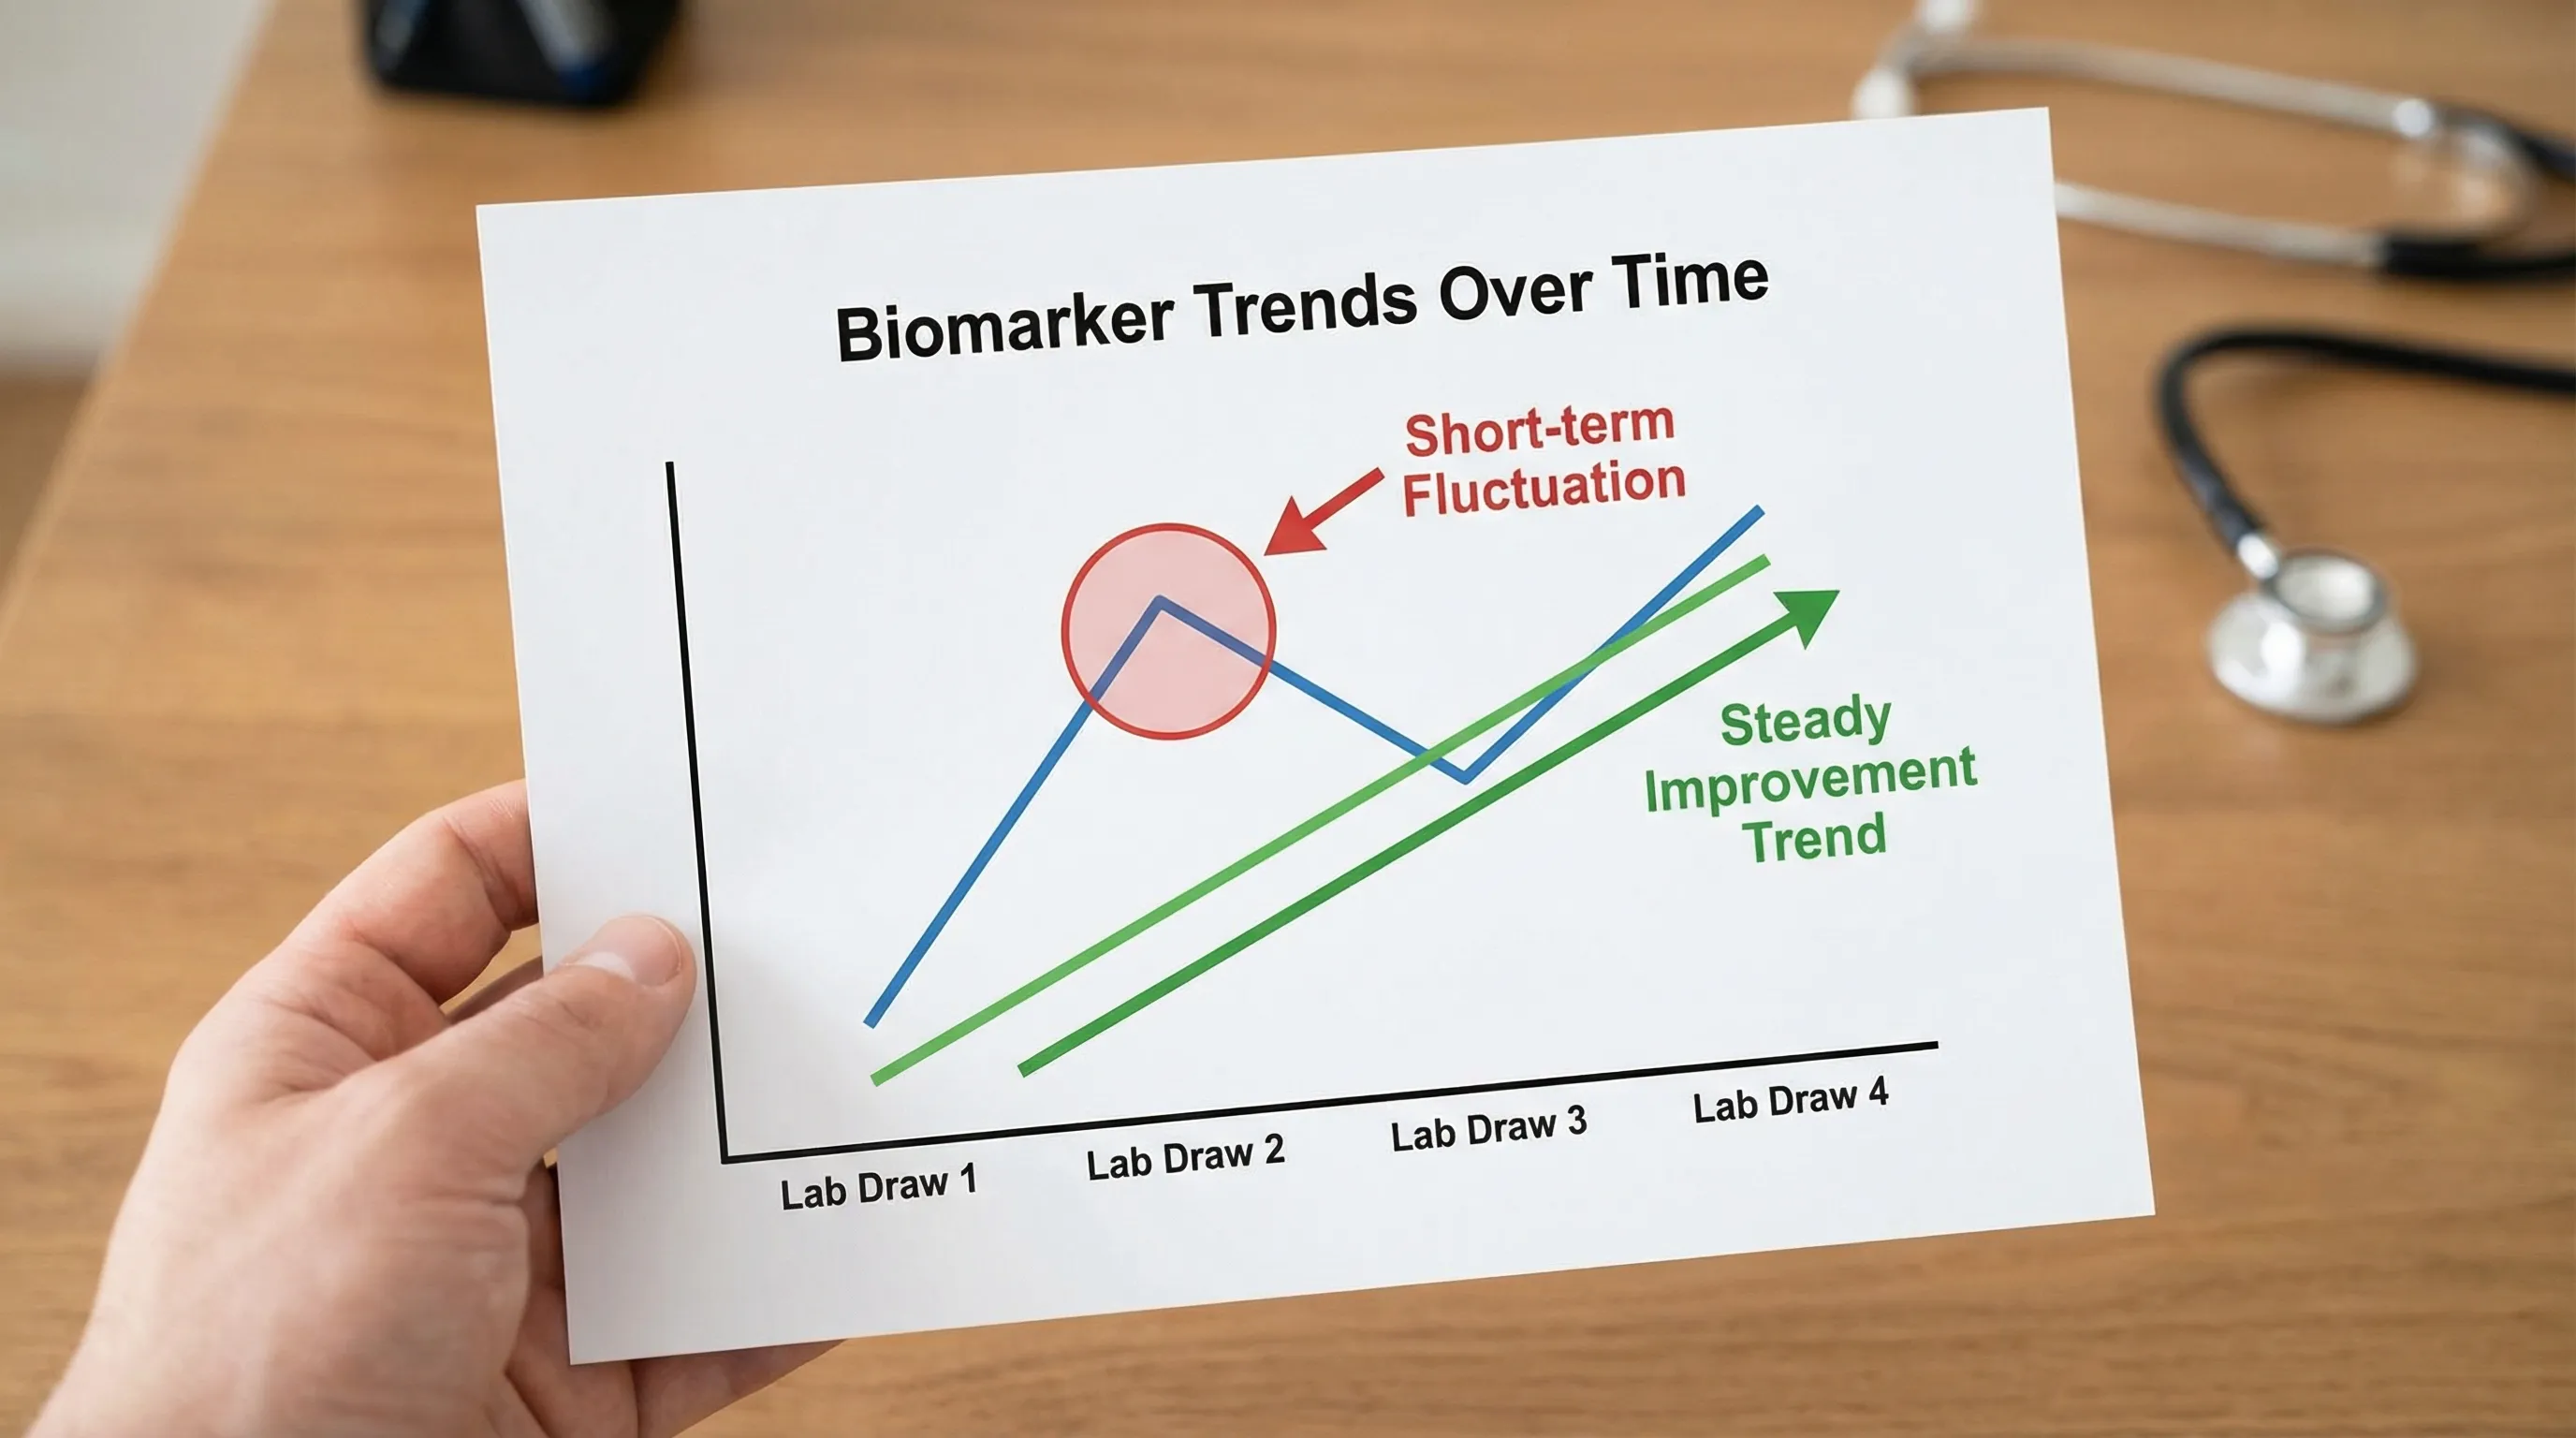
Step 5: Track trends (this is where labs become a longevity tool)
Single tests are useful, but trends are where you learn your physiology.
A simple trend system:
- Retest on a consistent cadence (often every 3 to 6 months for optimization, or as clinically advised)
- Repeat under similar conditions (fasting, time of day, training load)
- Compare to your own baseline, not only the lab’s reference range
A key concept clinicians use is biological variability, your markers naturally fluctuate. That’s why direction and persistence matter more than one “weird” number.
For a patient-friendly overview of why results vary and how to interpret them, see Testing.com’s guide to lab test results.
Common abbreviations that confuse people (quick translation table)
Swipe
Frequently Asked Questions
What does the “reference range” mean when reading blood test results? The reference range is the lab’s statistical range for a broad population using that lab’s method. It is not a personal target and it is not the same as an “optimal” range for performance or longevity.
Should I worry if one result is slightly high or low? Not automatically. Mild, isolated flags are often due to context (hydration, fasting, training, sleep, illness). The best next step is usually to look for related markers and retest under standardized conditions.
Do I need to fast before bloodwork? It depends on the tests. Fasting commonly affects triglycerides and glucose-related markers. If you are tracking trends, be consistent (same fasting status each time) so comparisons are meaningful.
Can supplements and medications change my lab results? Yes. Iron, B12, biotin, creatine, NSAIDs, statins, and many other agents can affect labs or interfere with testing. Document what you take and share it with your clinician when interpreting results.
How often should I recheck labs? It depends on the marker, your goals, and whether anything is abnormal. Many people recheck every 3 to 6 months when actively improving health metrics, and less frequently once stable. Follow clinician guidance for any abnormal or high-risk findings.
What’s the best way to track progress across multiple lab reports? Use the same units and, when possible, the same lab method, then trend key markers over time. Uploading past reports into a single place can make it easier to spot patterns.
Turn confusing labs into a clear action plan
If you want more than a generic “in range/out of range” view, Vitals Vault is built to make lab data usable. You can order comprehensive panels (100 to 160+ biomarkers), get clinician-reviewed insights in days, and follow daily longevity protocols tailored to your biology. Testing is available nationwide without a referral, HSA/FSA eligible, and plans start at $99 with a guarantee of at least 3 actionable insights or your money back.
Explore options at Vitals Vault.
Conclusion
If you want more than a generic “in range/out of range” view, Vitals Vault is built to make lab data usable. You can order comprehensive panels (100 to 160+ biomarkers), get clinician-reviewed insights in days, and follow daily longevity protocols tailored to your biology. Testing is available nationwide without a referral, HSA/FSA eligible, and plans start at $99 with a guarantee of at least 3 actionable insights or your money back.
Explore options at Vitals Vault.