
Back to Articles
How to Understand Blood Test Results Beyond “Normal”
Learn how to understand blood test results beyond “normal” using trends, patterns, and key biomarkers like apoB, hs-CRP, and fasting insulin.
Blood Test Interpretation
February 8, 2026
1 min read
Vitals Vault Team
Core Essential Wellness Panel
100+ Biomarkers & a thumbprint of your biological age
Includes the depth of physician-backed labs plus AI-reviewed storytelling so you can act on your physiology with confidence.
- 100+ doctor-curated functional medicine tests
- Personalised Action Plan + AI-reviewed clinical summary
- Upload, track, and securely share past reports
- PhenoAge score to measure your biological age
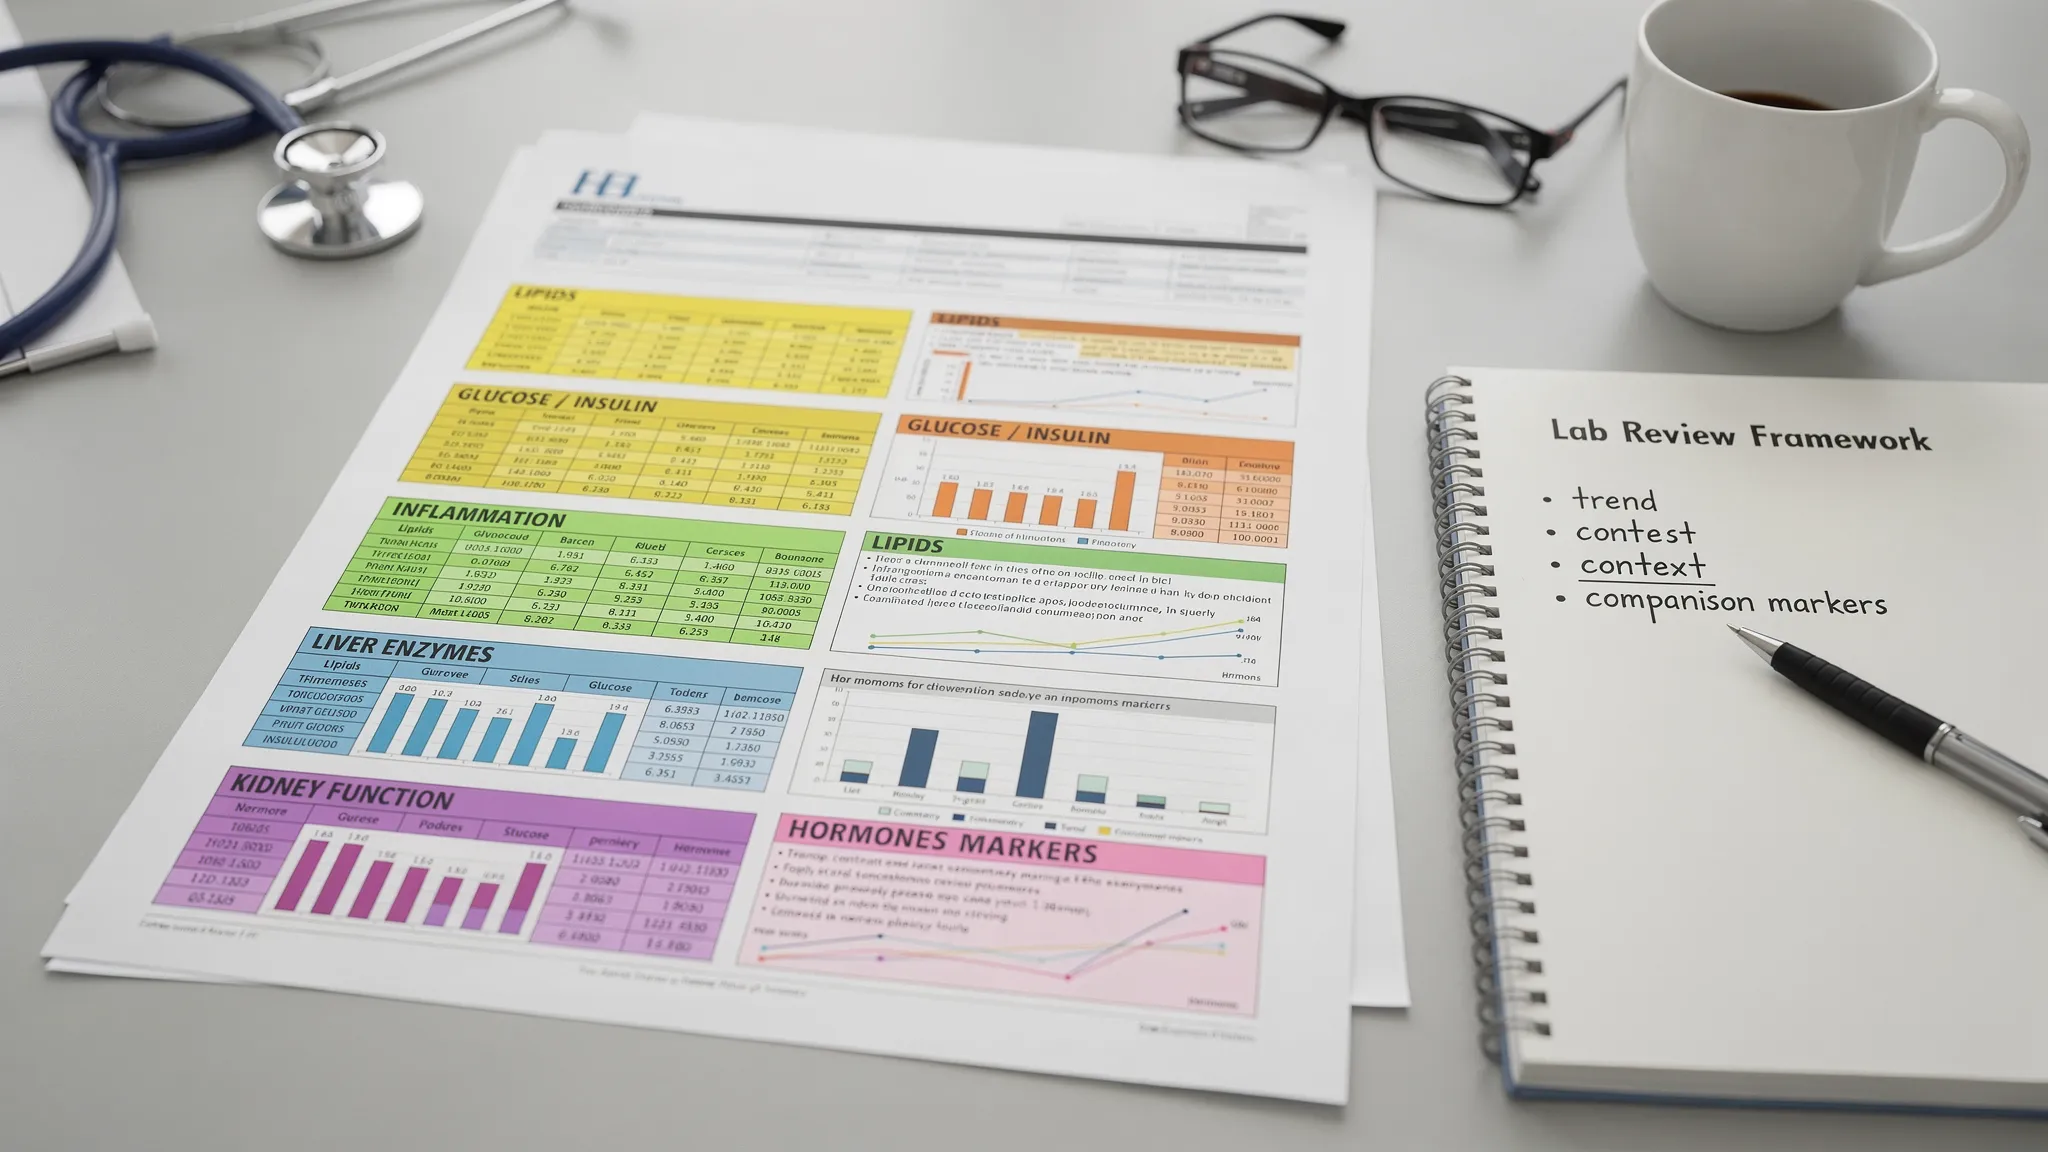
This article explores how to understand blood test results beyond the traditional "normal" range, focusing on performance, metabolic resilience, and longevity. It guides readers through interpreting lab results with context, recognizing patterns, and using companion markers rather than relying solely on individual numbers. Designed for anyone seeking deeper insight into their health, it explains when and how to order comprehensive blood panels to gain a more meaningful view of your biomarkers.
Most lab reports are designed to answer one question: “Is this value outside the population reference range?” But if your goal is performance, metabolic resilience, and longevity, that question is often too blunt.
You can feel exhausted, gain fat easily, or struggle with recovery while every line item still reads Normal. That is because “normal” usually means “common in the tested population,” not “optimal for your goals.” To understand blood test results beyond normal, you need context, patterns, and trends.
This guide explains how to do that safely and systematically (educational only, not medical advice), plus when it makes sense to order a more comprehensive panel without fighting for referrals.
What does “normal range” really mean on a blood test?
A lab’s reference range is typically derived from a large group of people and reflects where about 95% of results fall (the middle of the distribution). Two important implications follow:
First, reference ranges are not the same as risk thresholds. For example, cardiometabolic risk often rises gradually across a continuum. You can be “in range” and still be on the wrong side of a risk slope.
Second, the reference population can include people with early, undiagnosed disease. Many US adults have insulin resistance or fatty liver, so “normal” in a statistical sense can still be suboptimal for prevention.
If you want to understand blood test results beyond normal, treat reference ranges as a safety boundary, then layer in goal-based interpretation.
How do clinicians interpret labs “beyond normal” without guessing?
A clinician-style approach is less about any single flagged number and more about signal quality, patterns, and follow-up logic.
Step 1: Confirm the result is real (pre-analytics matter)
Before you interpret meaning, confirm the value is not a setup issue. Common confounders:
- Nonstandard fasting window (for triglycerides, glucose, fasting insulin)
- Dehydration (can concentrate albumin, hematocrit, BUN/creatinine ratio)
- Heavy training 24 to 72 hours prior (can shift AST/ALT, CK, some inflammatory markers)
- Alcohol in the prior 24 to 72 hours (can affect triglycerides, GGT, ALT)
- Acute illness (can temporarily raise hs-CRP, WBC, ferritin)
- Supplements and biotin (can interfere with some immunoassays)
If something looks “off” but the context screams confounder, the most intelligent move is often a repeat test under standardized conditions.
Step 2: Replace “single markers” with “systems”
Your body is a set of linked systems. Reading labs system-by-system reduces false alarms and improves actionability:
- Cardiometabolic: fasting glucose, HbA1c, fasting insulin, HOMA-IR
- Atherogenic risk: apoB, Lp(a), non-HDL-C, triglycerides/HDL relationship
- Inflammation: hs-CRP, sometimes ESR (sed rate) in context
- Liver: ALT, AST, GGT, bilirubin
- Kidney: creatinine, eGFR, urine albumin-to-creatinine ratio
- Hematology and oxygen delivery: hemoglobin, hematocrit, RBC indices like MCH/MCV/RDW
- Nutrients and methylation: ferritin, B12, vitamin D (25-OH), homocysteine
- Hormones and stress: thyroid (TSH, free T4, free T3), sex hormones (testosterone, estradiol), adrenal markers like cortisol and DHEA-S
Step 3: Use companion markers to avoid the classic misreads
Many “normal-but-not-optimal” interpretations come from missing the companion test that makes a result meaningful.
Here are a few high-yield examples:
Swipe
If you want deeper reading on a few of these, see Vitals Vault’s biomarker guides for ApoB, hs-CRP, and Lp(a).
Which “normal” results are most often not optimal for longevity goals?
This is where people get stuck, especially if they feel dismissed by traditional care. You are told “everything is normal,” yet your energy, weight, sleep, or training adaptation says otherwise.
Below are patterns that commonly deserve a second look, even when still technically in range.
Cardiometabolic: normal glucose can hide early insulin resistance
If fasting glucose and HbA1c are normal, that is good news, but it does not rule out early insulin resistance.
If fasting insulin is elevated relative to your baseline, or HOMA-IR trends up over time, that can be an early signal that your body is working harder to maintain normal glucose.
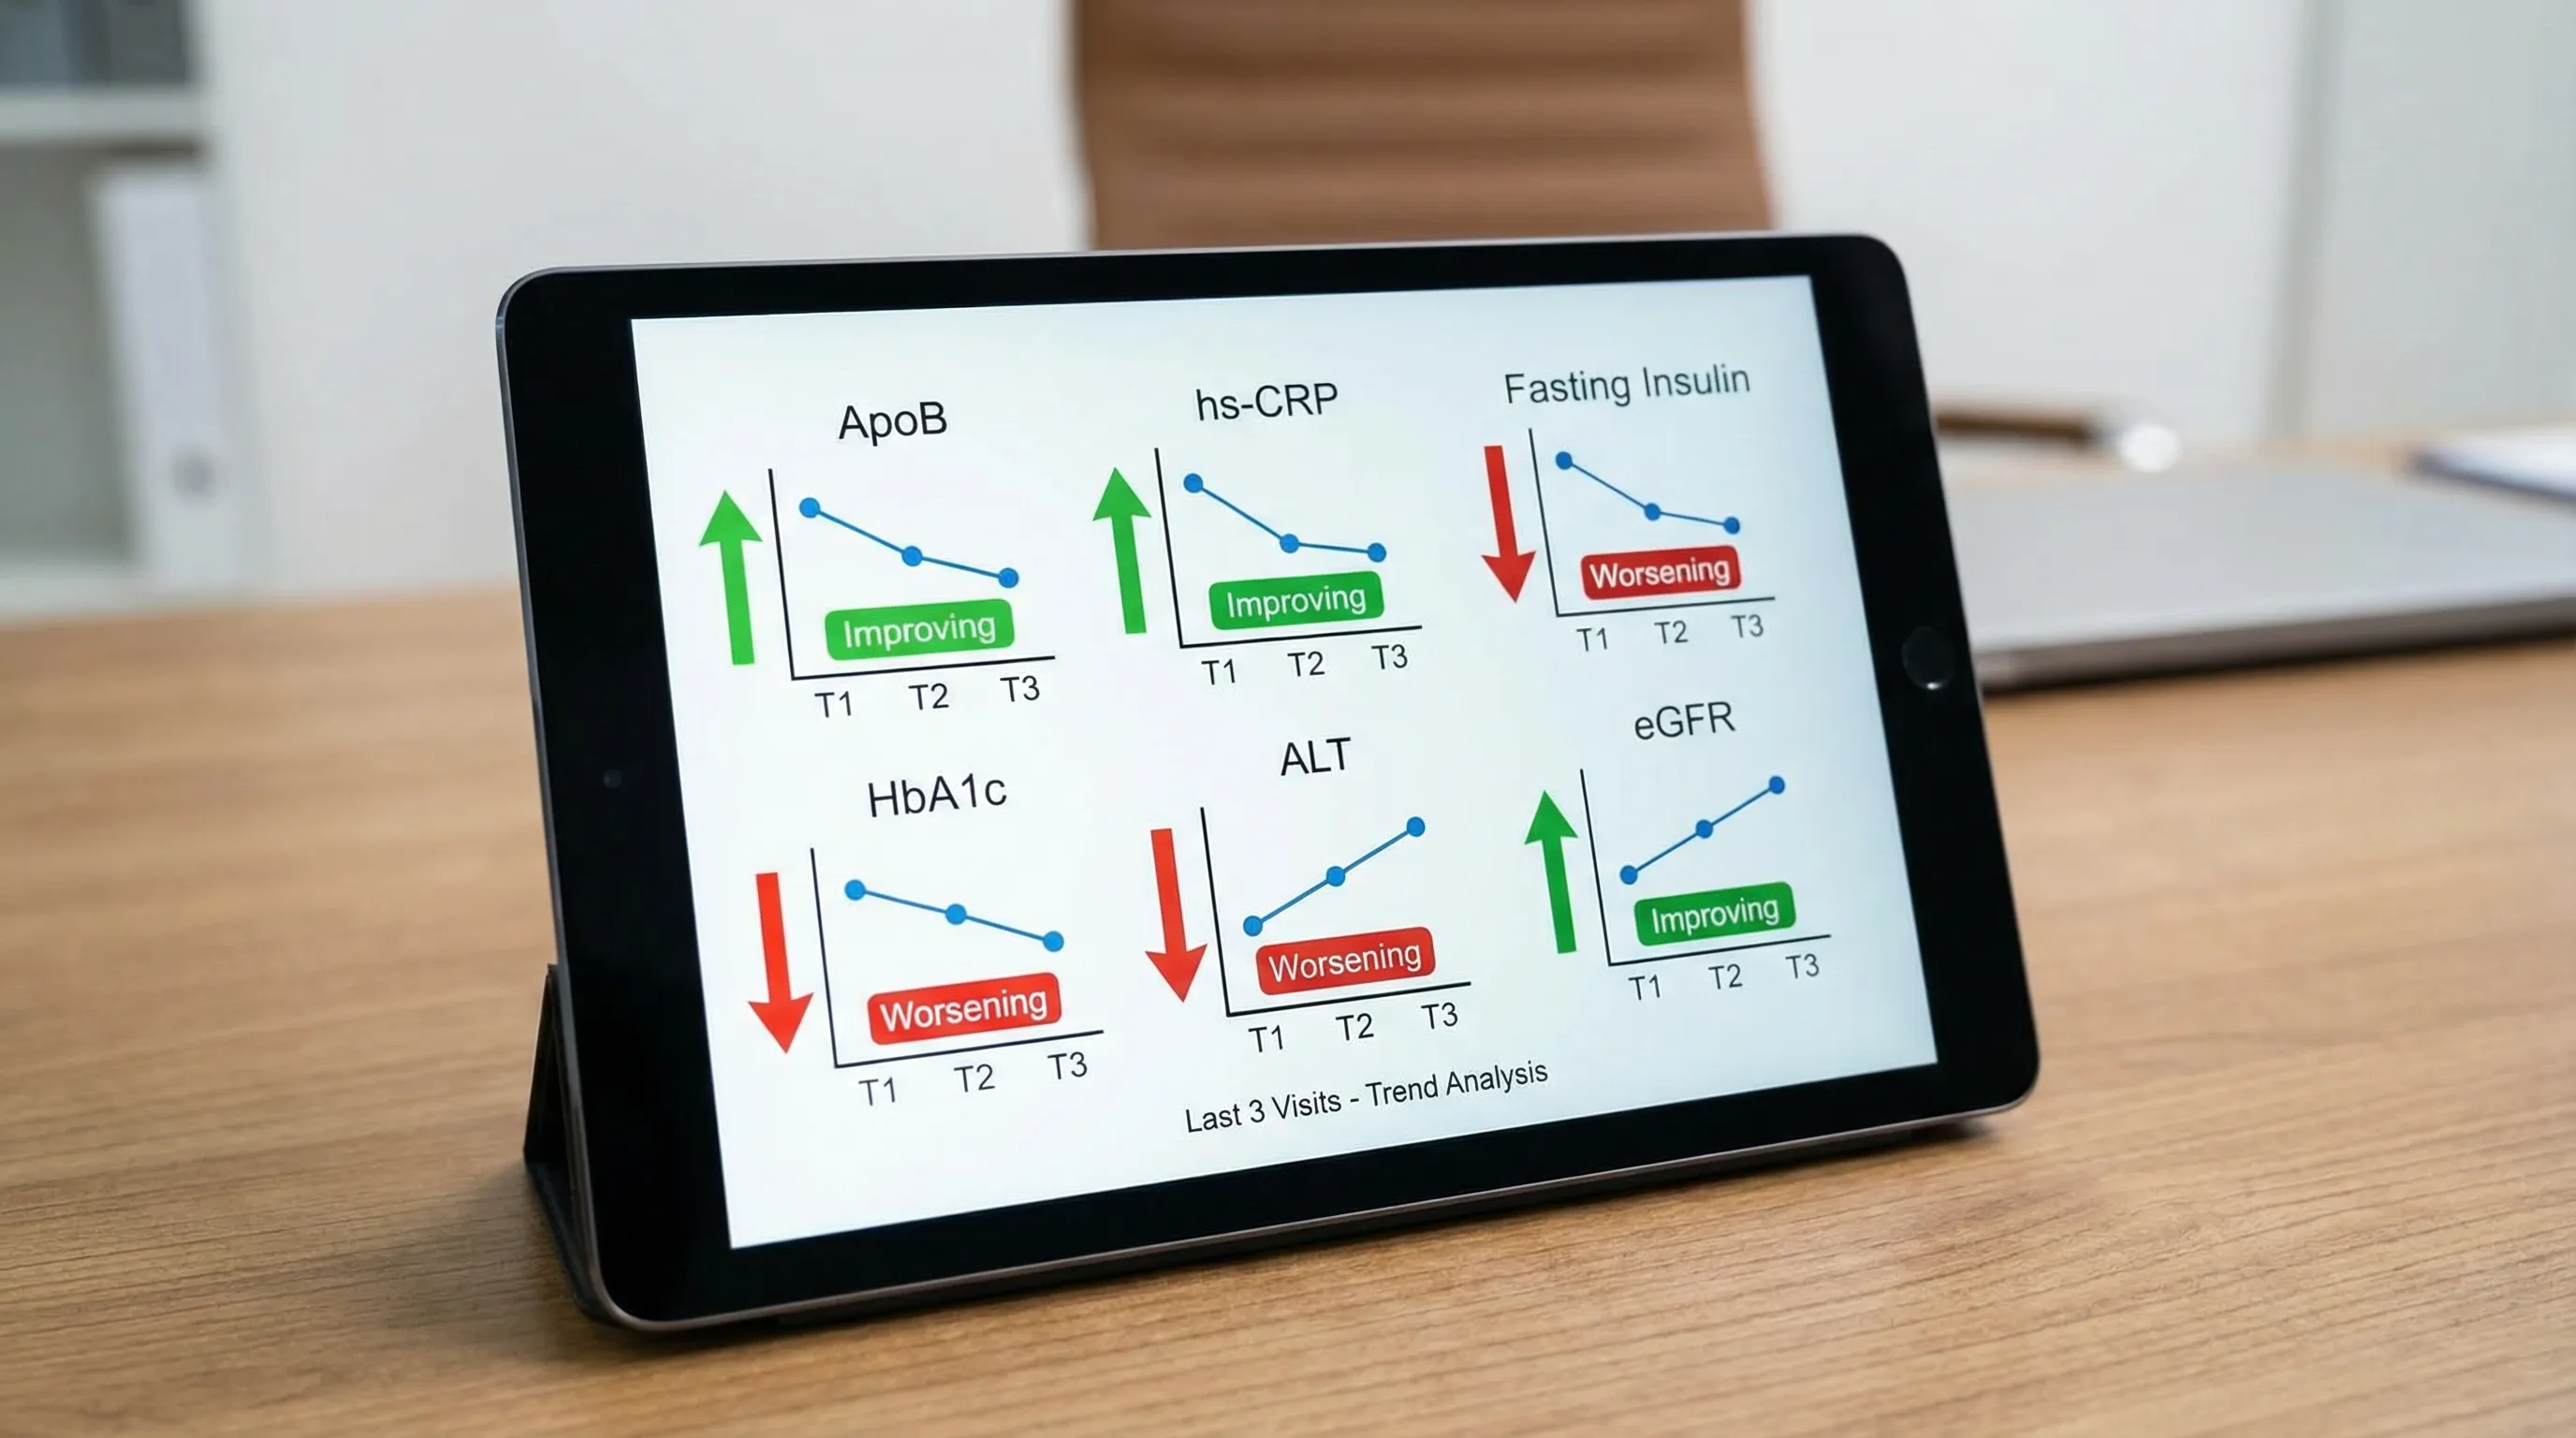
Practical interpretation tip: in proactive medicine, it is the direction of travel (trend) and clustering with triglycerides, HDL, waist circumference, blood pressure, and liver enzymes that matters.
Lipids: LDL-C is not the whole story
Many people with “acceptable” LDL-C still have elevated apoB (more atherogenic particles) or genetically elevated Lp(a). Those markers are easy to miss if your testing only includes a basic lipid panel.
If you are trying to understand blood test results beyond normal for cardiovascular prevention, adding apoB and Lp(a) is one of the highest ROI upgrades.
Inflammation: low-grade inflammation is often “normal” until it isn’t
hs-CRP is a workhorse marker for chronic low-grade inflammation. Even when it is not flagged, a persistent upward trend, especially alongside worsening insulin markers or lipids, can signal a lifestyle or recovery mismatch.
Context matters: repeat hs-CRP when you are not sick and not immediately post-marathon-style training.
Liver: mild enzyme drift can be an early metabolic clue
Mild elevations or high-normal drift in ALT, AST, and especially GGT can track with fatty liver risk, alcohol load, medication effects, and oxidative stress. It is rarely about a single value, it is about the pattern and persistence.
Kidney: eGFR and creatinine need individualized interpretation
Creatinine is influenced by muscle mass and hydration, which is why eGFR has known limitations at the individual level. If you lift heavily or eat high protein, your “normal” might look different than someone sedentary.
For prevention, trending and adding urinary markers (like urine albumin-to-creatinine ratio in the right context) can provide a clearer picture.
Hormones: reference ranges are wide, symptoms are specific
Sex hormones and thyroid markers have broad ranges, plus strong time-of-day and cycle effects.
Examples of common mismatches:
- Total testosterone “normal,” but symptoms persist and free testosterone is not assessed.
- Estradiol measured with a less sensitive method when LC-MS/MS may be preferred in some scenarios (clinician decision).
- Cortisol measured once without considering diurnal rhythm.
Hormone interpretation is a place where clinician review is particularly valuable, because context (sleep, stress, medications, training, cycle timing) changes meaning.
How do you know when a “normal” lab deserves follow-up?
Use a simple triage framework:
1) It is normal variation and you monitor. Example: a one-off borderline value after travel, poor sleep, or a hard training week.
2) It is a pattern that deserves optimization. Example: fasting insulin creeping up, triglycerides rising, HDL falling, ALT inching higher.
3) It is a finding that deserves additional tests. Example: elevated ferritin plus normal iron, add hs-CRP and iron saturation to interpret inflammation vs iron overload patterns.
4) It is urgent or potentially dangerous. Example: critical lab alerts, severe anemia patterns, very high potassium, or results accompanied by chest pain, confusion, fainting, severe shortness of breath. In these cases, seek urgent care or emergency evaluation.
Why many people cannot get the labs they need (and what to do about it)
A common pain point is: “My doctor won’t order apoB, Lp(a), fasting insulin, or a full hormone panel.” That can happen for multiple reasons, including insurance coverage rules, visit time constraints, or differing clinical philosophies.
If you are proactively tracking for longevity, you typically need:
- More biomarkers in a single draw (to interpret patterns)
- Repeatable cadence (to interpret trends)
- A report that explains what to do next, not just what is flagged
That is the gap programs like Vitals Vault are built to fill.
Vitals Vault vs Function Health, InsideTracker, Superpower, and Mito Health (what’s different?)
If your goal is to understand blood test results beyond normal, panel depth and interpretive support matter.
Vitals Vault is positioned as the comprehensive, affordable alternative, with 100 to 160+ biomarkers, clinician-reviewed insights, and no waitlist.
Swipe
For deeper side-by-side breakdowns, Vitals Vault publishes updated comparisons, including Function Health vs Vitals Vault and InsideTracker vs Vitals Vault.
A practical “beyond normal” checklist you can use on your next lab report
Most people do not need to become experts in every marker. You need a repeatable checklist.
- Confirm conditions: fasting window, hydration, recent illness, recent heavy training, alcohol.
- Scan for systems patterns: glucose/insulin, lipids/apoB, inflammation, liver, kidney, blood counts, nutrients, hormones.
- Look for clustering: multiple markers drifting in the same direction beats one weird number.
- Compare to your baseline: trends over 2 to 4 data points are usually more meaningful than one snapshot.
- Decide the next action: monitor, retest standardized, add companion markers, or clinician follow-up.
If you want a library-style way to learn each marker, start with the Vitals Vault biomarkers hub.
Frequently Asked Questions
How can I understand blood test results if everything is “normal”? You can go beyond “normal” by focusing on trends over time, using companion markers (for example apoB with LDL-C, fasting insulin with glucose), and interpreting results as systems rather than isolated values.
What are the most important biomarkers to add for longevity tracking? Common high-impact additions include apoB, Lp(a), hs-CRP, fasting insulin (and HOMA-IR), HbA1c, eGFR/creatinine, and nutrient markers like ferritin, vitamin D (25-OH), and B12, depending on your goals and history.
Why would fasting insulin matter if my glucose is normal? Insulin resistance can develop before glucose becomes abnormal. Fasting insulin and HOMA-IR can reveal whether your body is compensating to keep glucose in range.
Should I retest an abnormal result right away? Sometimes, yes, but it depends. If the result could be explained by dehydration, illness, or training, retesting under standardized conditions is often the smartest first step. If you have critical values or concerning symptoms, seek urgent medical care.
Can I order blood work without a doctor referral? Yes. With Vitals Vault, you can order comprehensive panels with no doctor referral needed, then receive clinician-reviewed insights.
How fast can I get results? Vitals Vault reports results in 24 to 48 hours in many cases after the lab draw (timing can vary by test and lab processing).
Get clarity that goes beyond “normal”
If you are tired of being told your labs are “fine” while you still feel off, consider a panel built for patterns, not just red flags.
With Vitals Vault, you can order 100 to 160+ biomarkers with no doctor referral needed, draw at 2,000+ Quest/Labcorp locations, and receive clinician-reviewed insights designed for proactive health and longevity.
- Explore what each marker means: Vitals Vault Biomarkers
- Order your comprehensive panel: Checkout
Conclusion
Understanding blood test results beyond "normal" involves looking at trends, patterns, and systems rather than isolated values. By incorporating companion markers and considering individual context, you can better assess your health and identify areas for optimization. Use the checklist and framework provided to make informed decisions about monitoring, retesting, or seeking further clinical evaluation based on your results.