
Back to Articles
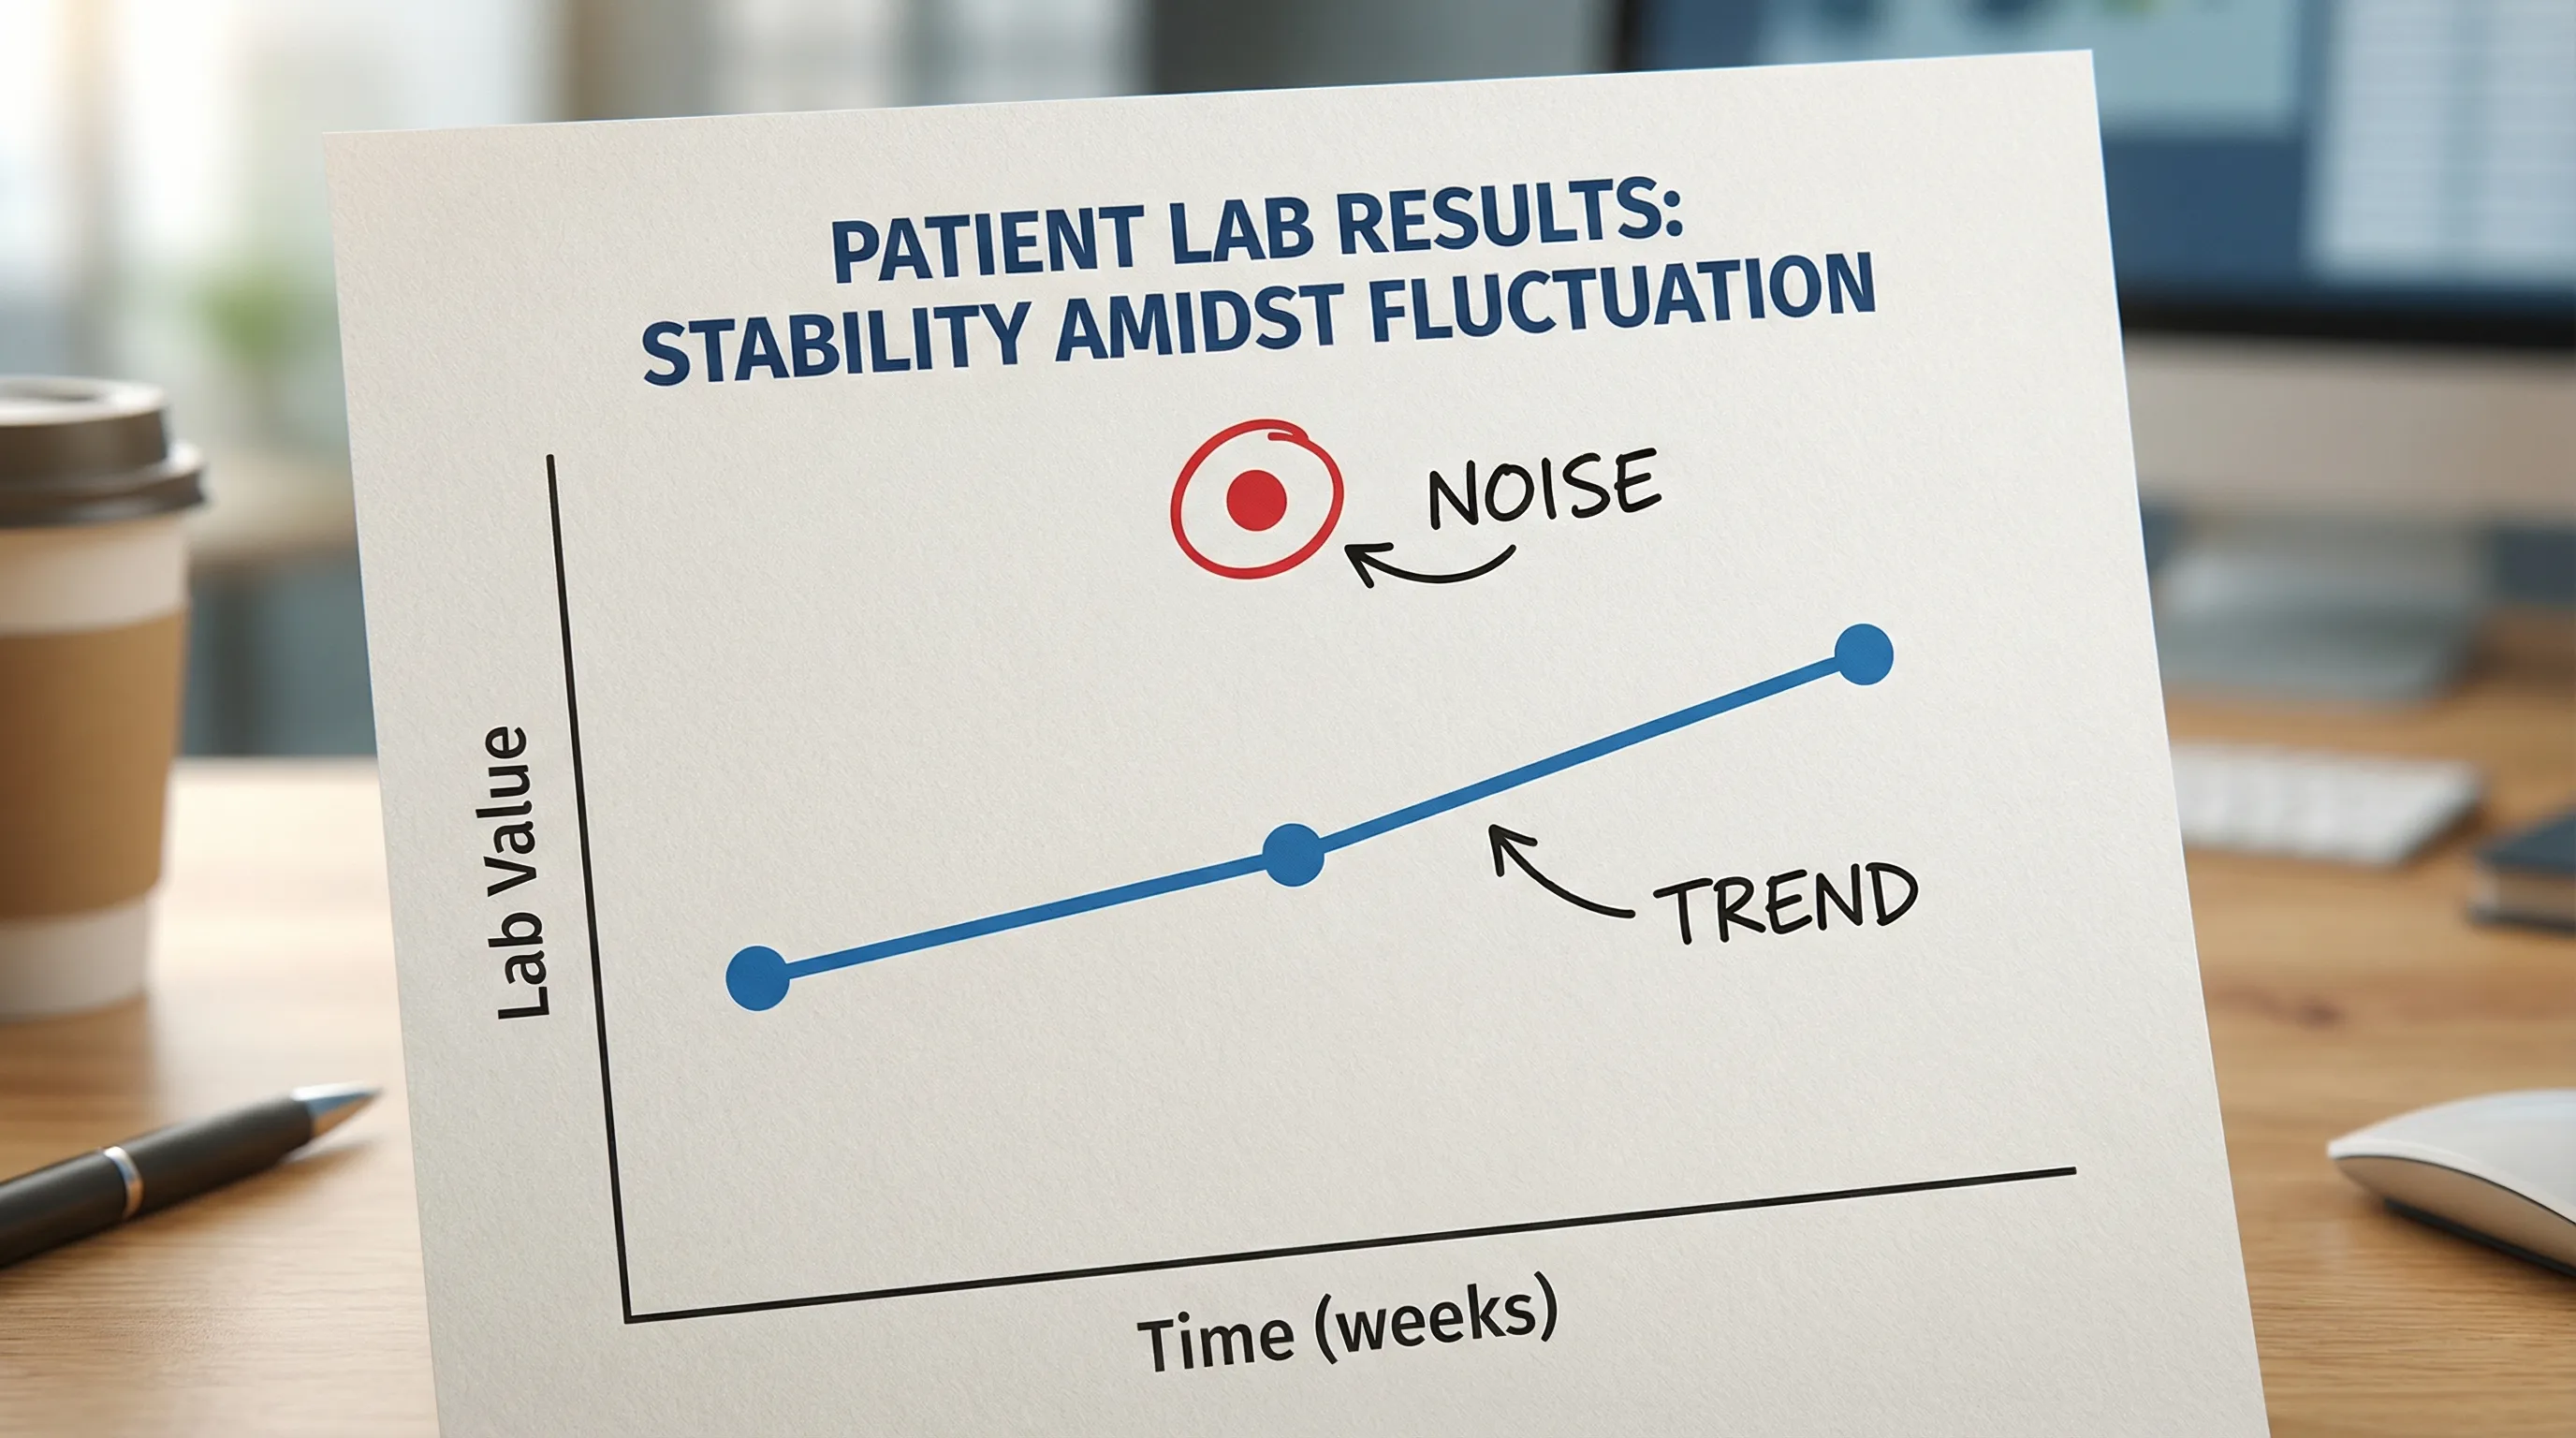
Blood Work: How to Read Results for Trends, Not Noise
Blood work how to read results for trends, not noise. Learn what changes matter, how to retest, and which biomarkers to track for longevity.
April 28, 2026
1 min read
Vitals Vault Team
Core Essential Wellness Panel
120+ Biomarkers & a thumbprint of your biological age
Includes the depth of physician-backed labs plus AI-reviewed storytelling so you can act on your physiology with confidence.
- 120+ doctor-curated functional medicine tests
- Personalised Action Plan + AI-reviewed clinical summary
- Upload, track, and securely share past reports
- PhenoAge score to measure your biological age
This article provides a comprehensive guide on how to interpret blood work results by focusing on trends rather than isolated values. Designed for individuals interested in health optimization and longevity, it explains why single lab results can be misleading and offers practical steps to standardize testing, build baselines, and confirm meaningful changes through companion markers. By understanding biological and analytical variations, readers can make informed decisions with their blood work how to read results effectively.
If you have ever Googled “blood work how to read results” right after seeing a few flagged numbers, you are not alone. The most common mistake is treating one lab draw like a verdict. Clinicians do the opposite: they look for patterns across time, ask what could have skewed the draw, and compare related biomarkers to confirm whether a change is real.
This guide shows you how to read blood work results for trends, not noise, so you can make smarter decisions (and avoid panic, false reassurance, or chasing random supplements).
Educational only, not medical advice. If your report shows a “critical” alert or you feel unwell, seek urgent medical care.
Why single lab results can mislead (even when they are “normal”)
A lab report is a snapshot taken under imperfect conditions. There are three big reasons a single value can be noisy.
1) Reference ranges are population ranges, not your personal baseline
Most lab “normal ranges” are built from large populations, often representing the middle 95% of values. That means:
- You can be “in range” while trending in the wrong direction for you.
- You can be slightly “out of range” due to temporary factors (sleep loss, dehydration, recent training, timing).
For longevity-focused tracking, your goal is usually personal stability and directionality, not just staying inside a wide population band.
2) Normal biological variation is real
Many biomarkers fluctuate day to day based on:
- Sleep and stress (common with cortisol, glucose, inflammation markers)
- Hydration and sodium intake (common with creatinine, BUN/creatinine ratio, electrolytes)
- Recent exercise (can shift CK, AST/ALT, and even inflammatory signals)
- Menstrual cycle phase (affects multiple hormones)
This concept is well-established in lab medicine as within-person biological variation. One useful implication is that “meaningful change” is often bigger than you think.
3) Lab and pre-analytical factors add “measurement noise”
Even with high-quality labs, results can shift due to:
- Different draw times (morning vs afternoon)
- Different fasting duration
- Tourniquet time, posture, or dehydration
- Different assays (for some hormones, method matters)
For background on biological and analytical variation, see resources like the EFLM Biological Variation Database and Westgard’s lab quality resources.
The “trends over noise” framework clinicians use
You do not need to be a statistician. You need a repeatable process.
Step 1: Standardize your blood draw conditions (so trends are comparable)
If you want trend clarity, make your draws boringly consistent.
Aim for consistency in:
- Time of day: morning is often easiest to replicate
- Fasting: typically 8 to 12 hours if you are trending metabolic markers (fasting glucose, fasting insulin, triglycerides)
- Hydration: normal water intake, avoid arriving dehydrated
- Exercise: avoid unusually hard training in the 24 to 48 hours before the draw if you are trend-tracking inflammation or liver enzymes
- Alcohol: avoid heavy intake for 24 to 72 hours before a baseline draw
- Supplements and meds: do not change routines right before testing, and document what you take
If you want a deeper prep checklist, see Vitals Vault’s guide on blood sample basics.
Step 2: Build a baseline before you “optimize”
A single test is a starting point. A baseline is typically:
- Two data points to confirm whether something repeats
- Three data points if you want to confidently see direction (especially for variable markers like hs-CRP)
If you change diet, training, sleep, or medication and test again immediately, you will not know whether the change you see is the intervention or the usual fluctuation.
Step 3: Interpret changes in context (confirm with companion markers)
A high-signal interpretation uses clusters.
Examples:
- Cardiometabolic risk: ApoB + triglycerides + HDL-C + fasting insulin + HbA1c
- Inflammation: hs-CRP + CBC differential (and symptoms or recent infection context)
- Iron status: ferritin + serum iron + transferrin saturation + CRP
- Kidney screening: creatinine + eGFR + urine albumin-to-creatinine ratio
Vitals Vault publishes deep-dive biomarker pages you can use as companions, including ApoB, hs-CRP, eGFR, and ferritin.
Step 4: Ask “is this change big enough to be real?”
Clinicians sometimes use tools like reference change value (RCV) to judge whether a delta likely exceeds expected biological and analytical variation. You do not need to calculate RCV to benefit from the idea.
Use this practical rule:
- Small shifts near your usual level are often noise, especially if the draw conditions changed.
- Larger shifts that repeat on a retest (with similar prep) are more likely signal.
- Cross-confirmation with related markers increases confidence.
A simple “noise vs signal” checklist (save this)
Swipe
High-value biomarkers to trend (and how often)
Below is a longevity-oriented trend table designed for people who want clarity on the few markers that frequently produce actionable insights.
Swipe
Notes:
- For some markers (especially hormones), test timing and assay choice can be the difference between noise and clarity.
- If you want a broader annual panel checklist, see Full Blood Check: Best Tests to Run at Least Yearly.
Two examples: reading trends the right way
Example 1: “My LDL went up, should I panic?”
A clinician-style approach:
- Do not interpret LDL-C in isolation.
- Check ApoB (particle burden), triglycerides, HDL-C, and ideally Lp(a).
- Ask whether your diet composition changed (especially saturated fat intake), whether weight changed, and whether the draw was fasted.
Why this works: LDL-C can shift with dietary patterns and fasting status. ApoB often provides clearer signal about atherogenic particle number, which is why many preventive clinicians prefer trending it alongside traditional lipids.
Example 2: “My hs-CRP is elevated, is that chronic inflammation?”
A clinician-style approach:
- Check context: recent infection, dental work, injury, heavy training, poor sleep.
- Review CBC patterns (WBC and differential).
- Retest hs-CRP when you are back to baseline, often after a couple of weeks.
Why this works: hs-CRP is a strong tool when interpreted as a trend. It is also sensitive to short-term immune events.
For a deeper hs-CRP interpretation guide, see Vitals Vault’s hs-CRP biomarker page.
When to escalate vs when to retest calmly
Most “borderline” surprises are solved by one of two things: correcting prep or repeating the test. But some situations should not wait.
Escalate promptly (same day) if:
- Your lab report labels a result as critical
- You have concerning symptoms (chest pain, fainting, severe shortness of breath, confusion)
- A clinician has already told you to monitor a specific risk (example: kidney disease, severe anemia)
Consider non-urgent follow-up and retesting if:
- You feel well and the result is mildly abnormal
- The value conflicts with everything else in that system (example: one odd electrolyte with the rest normal)
- Draw conditions were inconsistent (dehydration, poor sleep, unusual exercise)
If you are stuck in the “my doctor will not order the tests I want” loop, direct-to-consumer panels can be a practical way to build an evidence-based trendline, then bring those trends to your clinician for discussion.
The practical problem: most people do not have enough data to trend
You cannot trend what you do not test, and you cannot test consistently if you are dealing with:
- referrals and wait times
- piecemeal ordering and missing companion markers
- reports that do not help you connect systems
That is the gap Vitals Vault is built to close: 100 to 160+ biomarkers, clinician-reviewed insights, and longitudinal tracking with no doctor referral needed. Most results arrive in 24 to 48 hours after the draw is processed (timing can vary by marker and lab volume).
Vitals Vault vs Function Health, InsideTracker, Superpower, and Mito Health (trend tracking perspective)
The best platform for “trends over noise” is the one that gives you enough biomarkers, repeats them predictably, and pairs them with clinician-level interpretation.
Swipe
If you want to see the full side-by-side details, Vitals Vault also publishes deep comparisons, including Function Health vs Vitals Vault and Vitals Vault vs InsideTracker.
Want cleaner trends? Start with a comprehensive panel and repeat it consistently
If your current labs feel fragmented, or your doctor will not order what you want, you can take control of the inputs.
- Explore what you can track across cardiometabolic, inflammation, hormones, and longevity markers on the Vitals Vault biomarker library.
- Order a comprehensive panel (HSA/FSA eligible) and start trending with clinician-reviewed insights at Vitals Vault checkout.
Frequently Asked Questions
Blood work how to read results: what should I look at first? Start with context (fasting, time of day, recent illness, exercise), then scan for critical flags, then interpret systems using companion markers (example: ApoB with lipids, fasting insulin with glucose).
How many blood tests do I need before I can see a real trend? Two tests help confirm whether a finding repeats. Three tests (with consistent prep) usually make direction clearer, especially for variable markers like hs-CRP.
What is the difference between “normal range” and “optimal range”? “Normal” is typically a population reference interval. “Optimal” is often a narrower target used in preventive or functional medicine to support risk reduction. Optimal targets can differ by age, sex, and goals, so they should be interpreted with clinical context.
Why did my fasting glucose change even though my diet is the same? Sleep, stress, illness, training load, and fasting duration can all shift fasting glucose. That is why trending fasting insulin and HbA1c alongside glucose can provide a more stable picture of insulin resistance.
How do I calculate HOMA-IR from my lab results? A common formula is: HOMA-IR = (fasting insulin in µIU/mL × fasting glucose in mg/dL) / 405. Interpret in context, and use the same units each time for trend consistency.
Is it normal for hs-CRP to fluctuate? Yes. hs-CRP can rise temporarily with infections, injuries, dental procedures, and intense exercise. A repeat elevation without an obvious cause is more informative than a single high reading.
Can I order blood work without a doctor? Yes. Vitals Vault lets you order comprehensive biomarker panels with no doctor referral needed, then provides clinician-reviewed insights to help you understand what to retest and what to discuss with your physician.
How fast will I get results? Many results are available in 24 to 48 hours after the lab processes the draw, depending on the specific biomarkers ordered and lab throughput.
Get results you can actually trend (not just a one-time report)
If you are serious about longevity, performance, or finally understanding unexplained fatigue or weight changes, the shortcut is not “more guessing.” It is more consistent data across the right biomarkers.
Start here:
- Browse markers and what they mean: Vitals Vault Biomarkers
- Order your comprehensive panel now: Checkout
Conclusion
Understanding blood work results requires looking beyond individual numbers to identify consistent patterns over time. By standardizing test conditions, confirming changes with multiple data points, and considering related biomarkers, you can distinguish real health signals from normal fluctuations or errors. This approach helps avoid unnecessary worry and supports smarter, evidence-based health decisions. Consider establishing a comprehensive and consistent testing routine to track your key biomarkers effectively.