
Back to Articles
Reading Blood Test Results: The 6 Biomarker Patterns to Watch
Reading blood test results? Learn the 6 biomarker patterns to watch (apoB, hs-CRP, fasting insulin, HOMA-IR, eGFR) and smarter next steps.
Blood Test Interpretation
February 16, 2026
1 min read
Vitals Vault Team
Core Essential Wellness Panel
100+ Biomarkers & a thumbprint of your biological age
Includes the depth of physician-backed labs plus AI-reviewed storytelling so you can act on your physiology with confidence.
- 100+ doctor-curated functional medicine tests
- Personalised Action Plan + AI-reviewed clinical summary
- Upload, track, and securely share past reports
- PhenoAge score to measure your biological age
This article provides a clear, educational guide on reading blood test results by focusing on six key biomarker patterns rather than isolated values. It is designed for individuals seeking to understand complex lab reports better, especially those interested in cardiometabolic risk, inflammation, liver and kidney function, and hormone balance. By recognizing patterns such as atherogenic particle overload, insulin resistance, and inflammation, readers can gain insight into their health status and make informed decisions about next steps.
Most people try to read blood test results line by line, chasing every “H” and “L” flag.
Clinicians do something different. They look for patterns across related biomarkers that point to a system-level story: cardiometabolic risk, inflammation, liver stress, kidney filtration, nutrient status, or hormone signaling.
This guide walks you through 6 high-signal biomarker patterns to watch so you can interpret labs with less guessing and better next steps. It is educational, not medical advice. If you have severe symptoms or a critical lab value, seek urgent medical care.
Before you interpret anything: 3 “false alarm” checks
When reading blood test results, a surprising number of “abnormal” values come from how the test was taken, not what is happening long-term.
1) Was the draw standardized?
For pattern recognition, consistency matters.
- Fasted vs non-fasted (especially for triglycerides and glucose)
- Hydration status (impacts creatinine, BUN/creatinine ratio, hematocrit)
- Hard training in the prior 24 to 48 hours (can shift CK, AST, creatinine)
- Alcohol in the prior 24 to 72 hours (can raise triglycerides, GGT)
- Acute illness, poor sleep, or recent vaccines (can raise hs-CRP and WBC)
2) Are you comparing to your own baseline?
“Normal range” is usually a population reference range. Your best signal often comes from trend changes over repeated draws.
3) Do you have the companion markers?
Single markers are easy to misread. Example: LDL-C alone can miss risk that shows up in apoB or Lp(a).
If you want deeper context fast, Vitals Vault lets you order comprehensive panels (100 to 160+ biomarkers) with no doctor referral needed, and many routine results return in 24 to 48 hours after your draw at 2,000+ Quest/Labcorp locations nationwide.
- Explore markers: Vitals Vault Biomarkers
- Order testing: Checkout
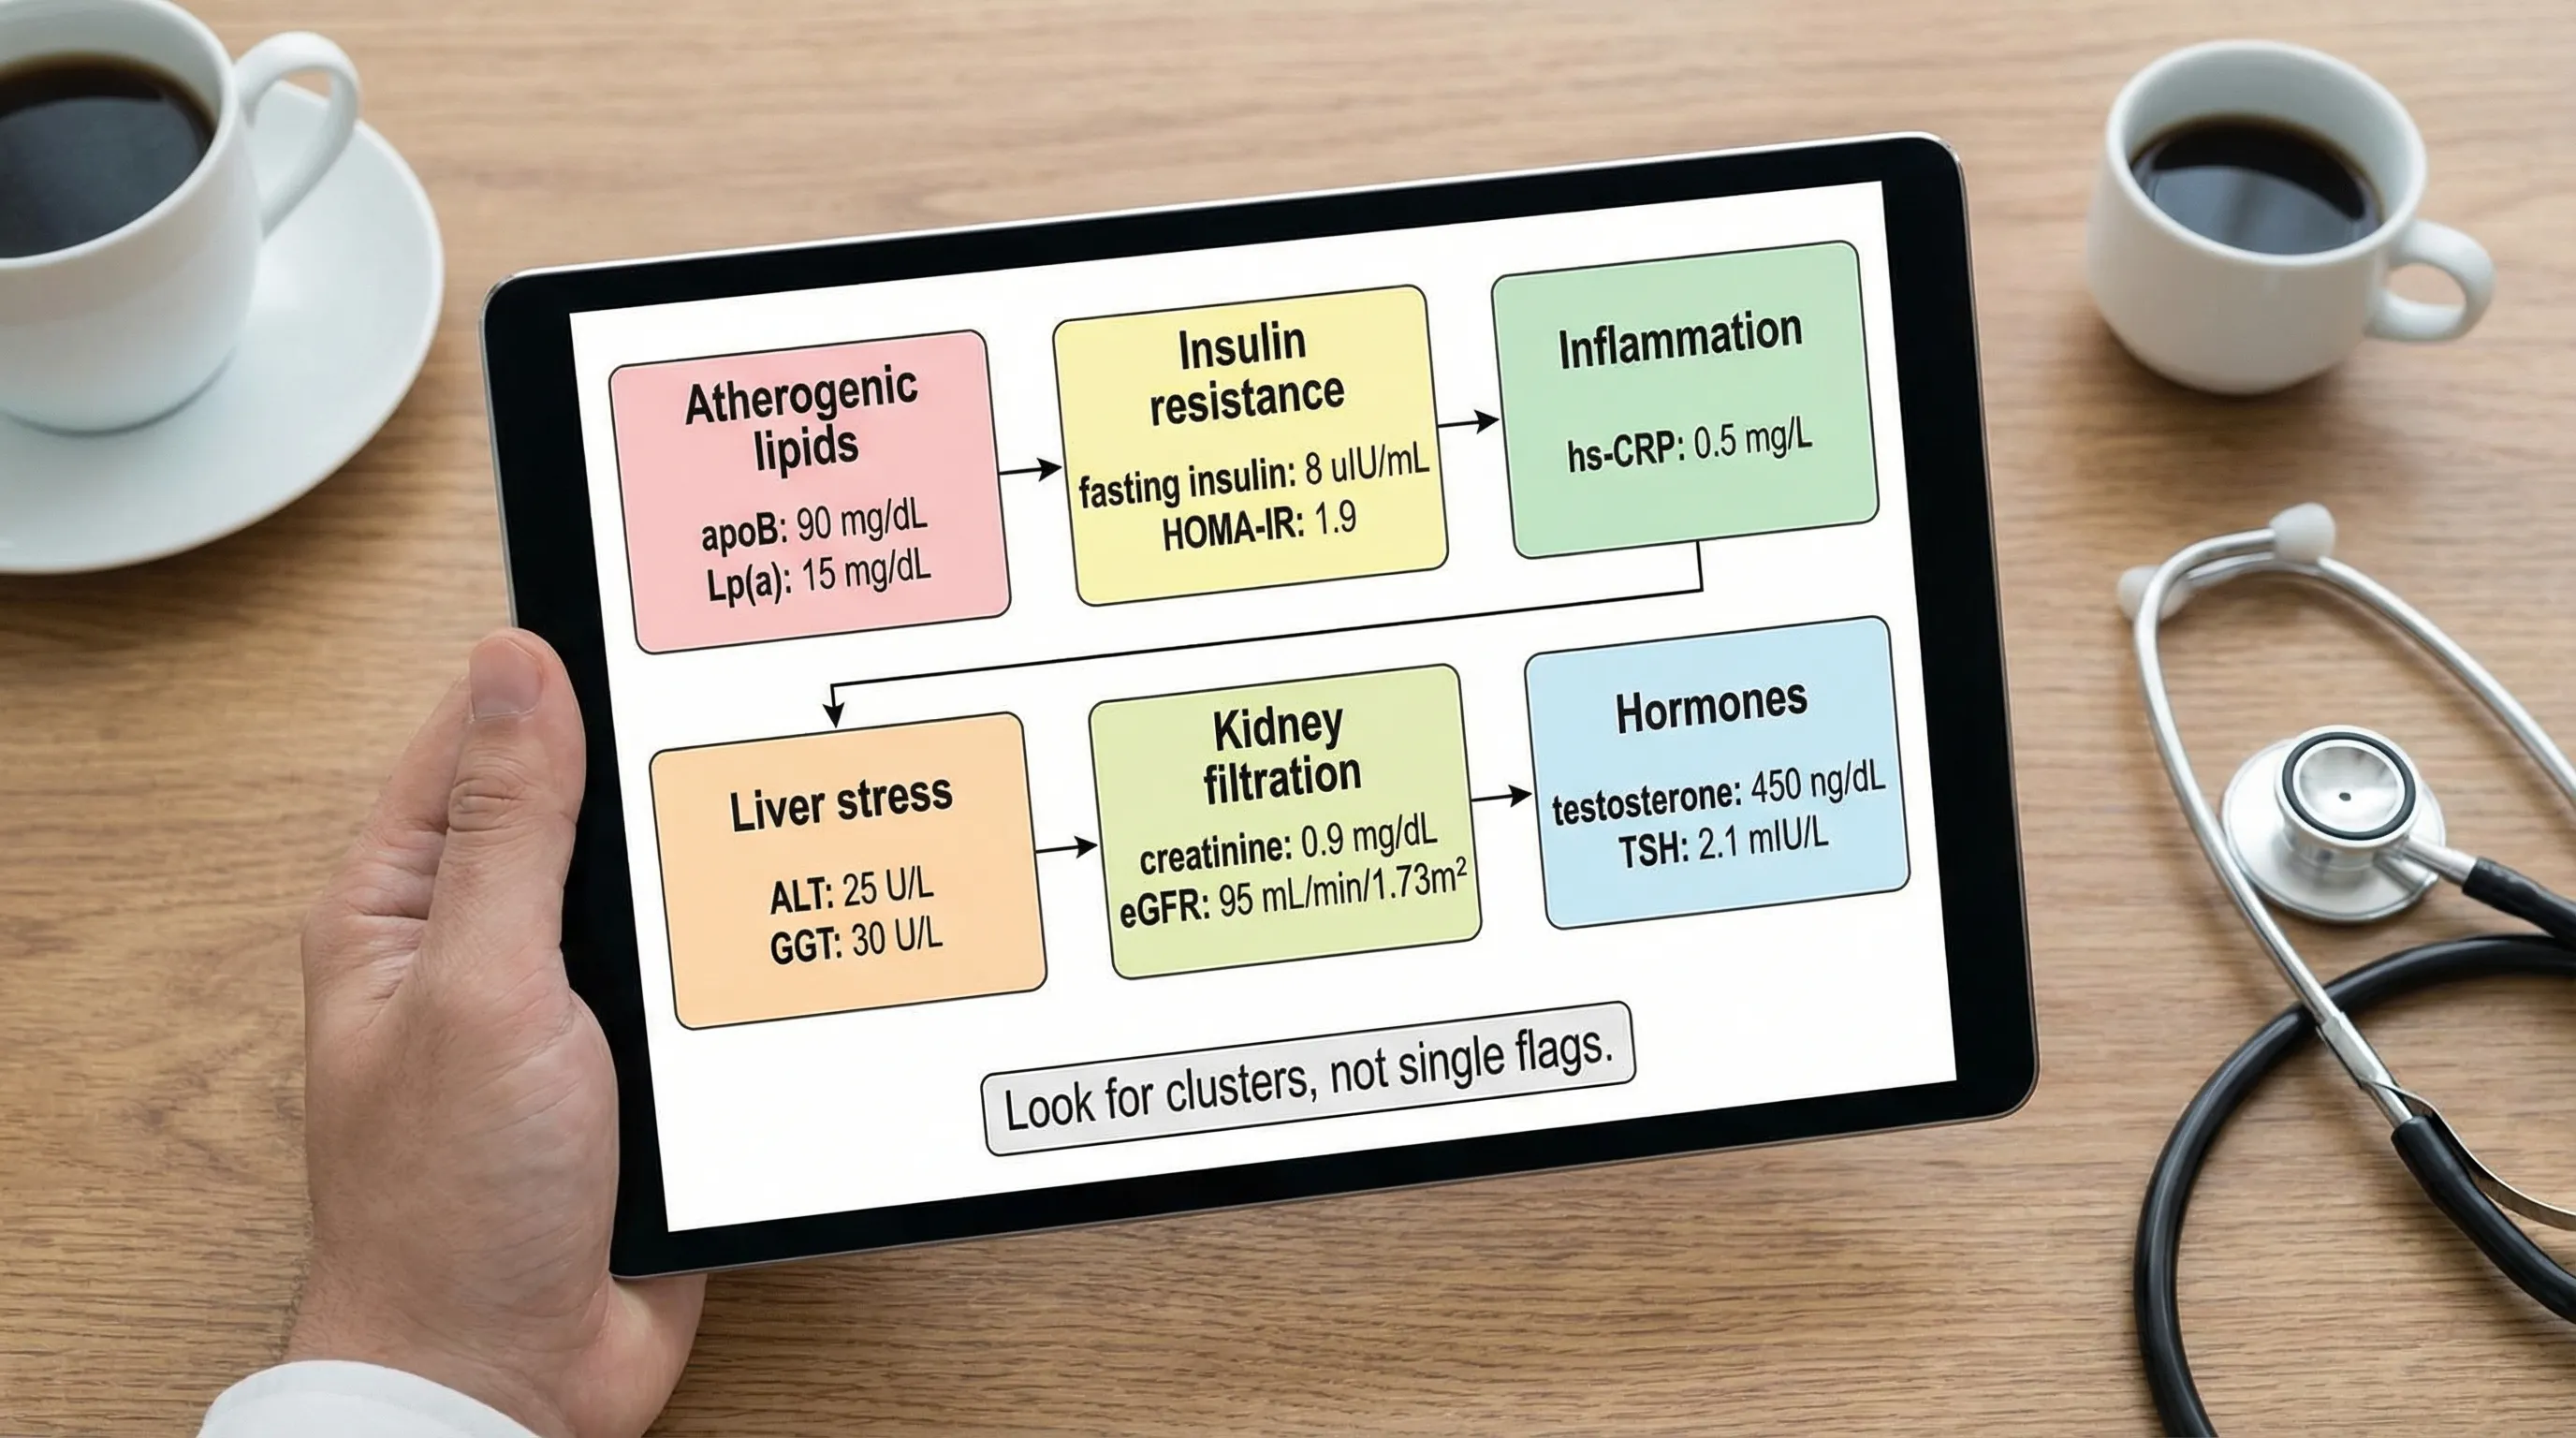
The 6 biomarker patterns to watch (clinician-style)
Here is a quick map of what you are looking for. Use it as your “pattern checklist” when reading blood test results.
Swipe
Pattern 1: Atherogenic particle overload (apoB is the headline)
If you only look at total cholesterol or LDL-C, you can miss the real risk driver: how many atherogenic particles are circulating.
What to look for
- apoB elevated (often the cleanest “particle count” proxy)
- Non-HDL-C elevated
- Triglycerides elevated and HDL low (often overlaps with insulin resistance)
- Lp(a) elevated (genetic risk amplifier)
This is the classic pattern where someone says: “My LDL isn’t that high, why is my clinician worried?” Often the missing piece is apoB.
Learn the deeper context on each:
Common interpretation mistakes
- Treating LDL-C as interchangeable with apoB
- Ignoring Lp(a) because “my LDL is fine”
- Looking at HDL as protective in isolation (HDL can be “good,” but patterns matter more)
Practical next steps (educational)
If this pattern shows up, it is worth checking whether it is driven by:
- Insulin resistance (Pattern 2)
- Inflammation (Pattern 3)
- Thyroid status (Pattern 6, hypothyroid patterns can worsen lipids)
Pattern 2: The insulin resistance stack (when glucose looks normal)
Many people are told, “Your fasting glucose is normal,” while their physiology is quietly shifting toward insulin resistance.
What to look for
- Fasting insulin elevated (can shift years before glucose)
- HOMA-IR elevated (calculated from fasting glucose and insulin)
- Triglycerides elevated
- HDL low
- ALT mildly elevated (often overlaps with liver fat risk)
Why it matters for longevity
This stack often correlates with energy crashes, weight gain, stubborn belly fat, blood pressure drift, and “normal” labs that do not feel normal.
Practical next steps (educational)
- Re-test under consistent conditions (true 8 to 12 hour fast, normal sleep, normal training)
- Pair cardiometabolic markers with inflammation and liver markers to see the whole picture
If your doctor will not order fasting insulin or apoB, this is a common reason people use direct lab access. Vitals Vault panels include cardiometabolic depth (including markers like apoB, hs-CRP, fasting insulin and HOMA-IR on many comprehensive options) with clinician-reviewed insights.
- Browse marker coverage: Vitals Vault Biomarkers
- Start now: Checkout
Pattern 3: Inflammation and immune activation (hs-CRP plus the CBC story)
Inflammation is where “one abnormal lab” becomes misleading fast. A mildly high hs-CRP after poor sleep is not the same as persistent elevation across repeated tests.
What to look for
- hs-CRP elevated
- WBC elevated (or low), with shifts in neutrophils, lymphocytes, or monocytes
- ESR (sed rate) elevated (less specific, but useful in context)
- Ferritin unusually high (can rise with inflammation) or low (iron depletion)
- Albumin low-normal alongside other inflammation signals
Vitals Vault has deep guides on:
Common interpretation mistakes
- Treating hs-CRP as a diagnosis (it is a signal, not a label)
- Forgetting timing (recent illness, intense training, dental work, or poor sleep can transiently raise markers)
Practical next steps (educational)
- If you were sick or sleep-deprived, re-test after recovery
- If it persists, look for overlap with Patterns 1 and 2 (inflammation often travels with cardiometabolic risk)
For kidney-specific inflammation signals, you can also evaluate urine markers (albumin-to-creatinine ratio, urine protein) depending on your situation.
Pattern 4: Liver stress and oxidative load (ALT is not enough)
Liver panels get oversimplified into “ALT and AST,” but for pattern reading, GGT often adds valuable context about oxidative stress, alcohol effects, and metabolic strain.
What to look for
- ALT elevated
- AST elevated
- GGT elevated
- Triglycerides elevated (often co-travels with fatty liver risk)
- Fasting insulin elevated (Pattern 2 overlap)
Deep dive:
Common interpretation mistakes
- Assuming any high ALT is “fatty liver” without context
- Ignoring short-term confounders (alcohol, new supplements, certain meds, hard exercise)
Practical next steps (educational)
- Repeat after removing confounders when appropriate
- Read liver markers alongside insulin resistance and lipids (Patterns 1 and 2)
Pattern 5: Kidney filtration and hydration (creatinine and eGFR in context)
Reading blood test results for kidney health is tricky because creatinine reflects both filtration and muscle mass, and dehydration can transiently worsen multiple kidney-adjacent markers.
What to look for
- Creatinine elevated with eGFR lower than expected
- BUN/creatinine ratio elevated (often dehydration, but not always)
- Urine albumin or urine protein present (important for risk stratification)
Vitals Vault references:
For general education on eGFR and kidney function, see the National Kidney Foundation.
Common interpretation mistakes
- Panicking about a single eGFR result without verifying hydration, recent exercise, and trend
- Assuming “normal creatinine” means “optimal kidney risk profile” without urine albumin context
Practical next steps (educational)
- Re-test under consistent hydration and training conditions
- Consider adding urine albumin-to-creatinine ratio if risk factors exist (hypertension, diabetes, family history)
Pattern 6: Hormone signaling mismatch (symptoms despite “in-range”)
Hormone panels are where people feel most dismissed: “Everything is normal,” but fatigue, weight change, sleep disruption, or libido changes persist.
A pattern approach helps because hormones act in axes (thyroid axis, gonadal axis, adrenal axis).
What to look for
- Testosterone, estradiol, LH, FSH not telling a coherent story together
- Thyroid pattern signals (TSH with free T4 and symptoms)
- Cortisol timing mismatch (single cortisol values can be timing-sensitive)
Vitals Vault hormone reading resources:
Common interpretation mistakes
- Testing at inconsistent times of day and comparing results
- Ignoring medications and lifestyle inputs (sleep, caloric restriction, endurance overtraining)
Practical next steps (educational)
- Re-test with correct timing and standardized prep
- Interpret hormone results alongside metabolic markers (Pattern 2) and inflammation (Pattern 3)
Why comprehensive panels beat piecemeal testing (and why many people switch)
If you only run a basic lipid panel and a CMP, you can miss the patterns above. This is why many health optimizers move beyond traditional care pathways that require referrals, long waits, or reluctant ordering.
Vitals Vault is positioned as a comprehensive, affordable alternative to Function Health, InsideTracker, Superpower, and Mito Health, especially for people who want more biomarkers per dollar, no waitlist, and clinician access included.
Swipe
If your goal is to consistently spot patterns like apoB plus hs-CRP plus fasting insulin (instead of guessing from LDL alone), a deeper panel is the fastest way to reduce uncertainty.
- See what you can test: Vitals Vault Biomarkers
Frequently Asked Questions
What is the biggest mistake when reading blood test results? The biggest mistake is interpreting one flagged value in isolation. Patterns across related markers (for example apoB with triglycerides and hs-CRP) are usually more informative.
What does high apoB mean if my LDL cholesterol is normal? It can mean you have more atherogenic particles than LDL-C alone suggests. apoB often clarifies risk when LDL-C appears “fine,” especially with insulin resistance patterns.
What biomarkers show early insulin resistance? Fasting insulin and HOMA-IR are often early signals, especially when paired with triglycerides, HDL, and HbA1c.
What does hs-CRP tell you on a blood test? hs-CRP is a marker of inflammation. It can rise transiently with infection, poor sleep, or hard training, so trends and context matter.
Why did my eGFR drop on one test? eGFR can shift with hydration status, recent intense exercise, and creatinine variation. A repeat test under standardized conditions and trend review is often appropriate.
Can I order blood tests without a doctor referral? Yes. Vitals Vault provides direct lab access with no doctor referral needed, plus clinician-reviewed insights to help you understand your results.
Get clearer answers faster with Vitals Vault
If you are tired of being told “everything looks normal” while your energy, weight, sleep, or performance says otherwise, the fastest improvement is usually better data and better interpretation.
Vitals Vault lets you order 100 to 160+ biomarker panels, get clinician-reviewed insights, and start daily longevity protocols tailored to your biology. No referrals, no waitlists, and many routine results return in 24 to 48 hours after your draw.
- Order your panel: https://www.vitalsvault.com/checkout
- Explore biomarkers first: https://www.vitalsvault.com/biomarkers
Conclusion
Understanding blood test results through the lens of biomarker patterns allows for a more accurate and insightful interpretation beyond single flagged values. By focusing on clusters related to cardiovascular health, metabolism, inflammation, liver and kidney function, and hormone signaling, individuals can better appreciate their underlying health dynamics. Considering consistent test conditions and trends over time is key to meaningful interpretation. Exploring these patterns can empower you to take thoughtful actions toward improved health.