
Back to Articles
How to Read Blood Test Results Like a Clinician
How to read blood test results like a clinician: understand reference ranges, spot patterns in ApoB, hs-CRP, insulin, and plan smart retests.
Blood Test Interpretation
February 7, 2026
1 min read
Vitals Vault Team
Core Essential Wellness Panel
100+ Biomarkers & a thumbprint of your biological age
Includes the depth of physician-backed labs plus AI-reviewed storytelling so you can act on your physiology with confidence.
- 100+ doctor-curated functional medicine tests
- Personalised Action Plan + AI-reviewed clinical summary
- Upload, track, and securely share past reports
- PhenoAge score to measure your biological age
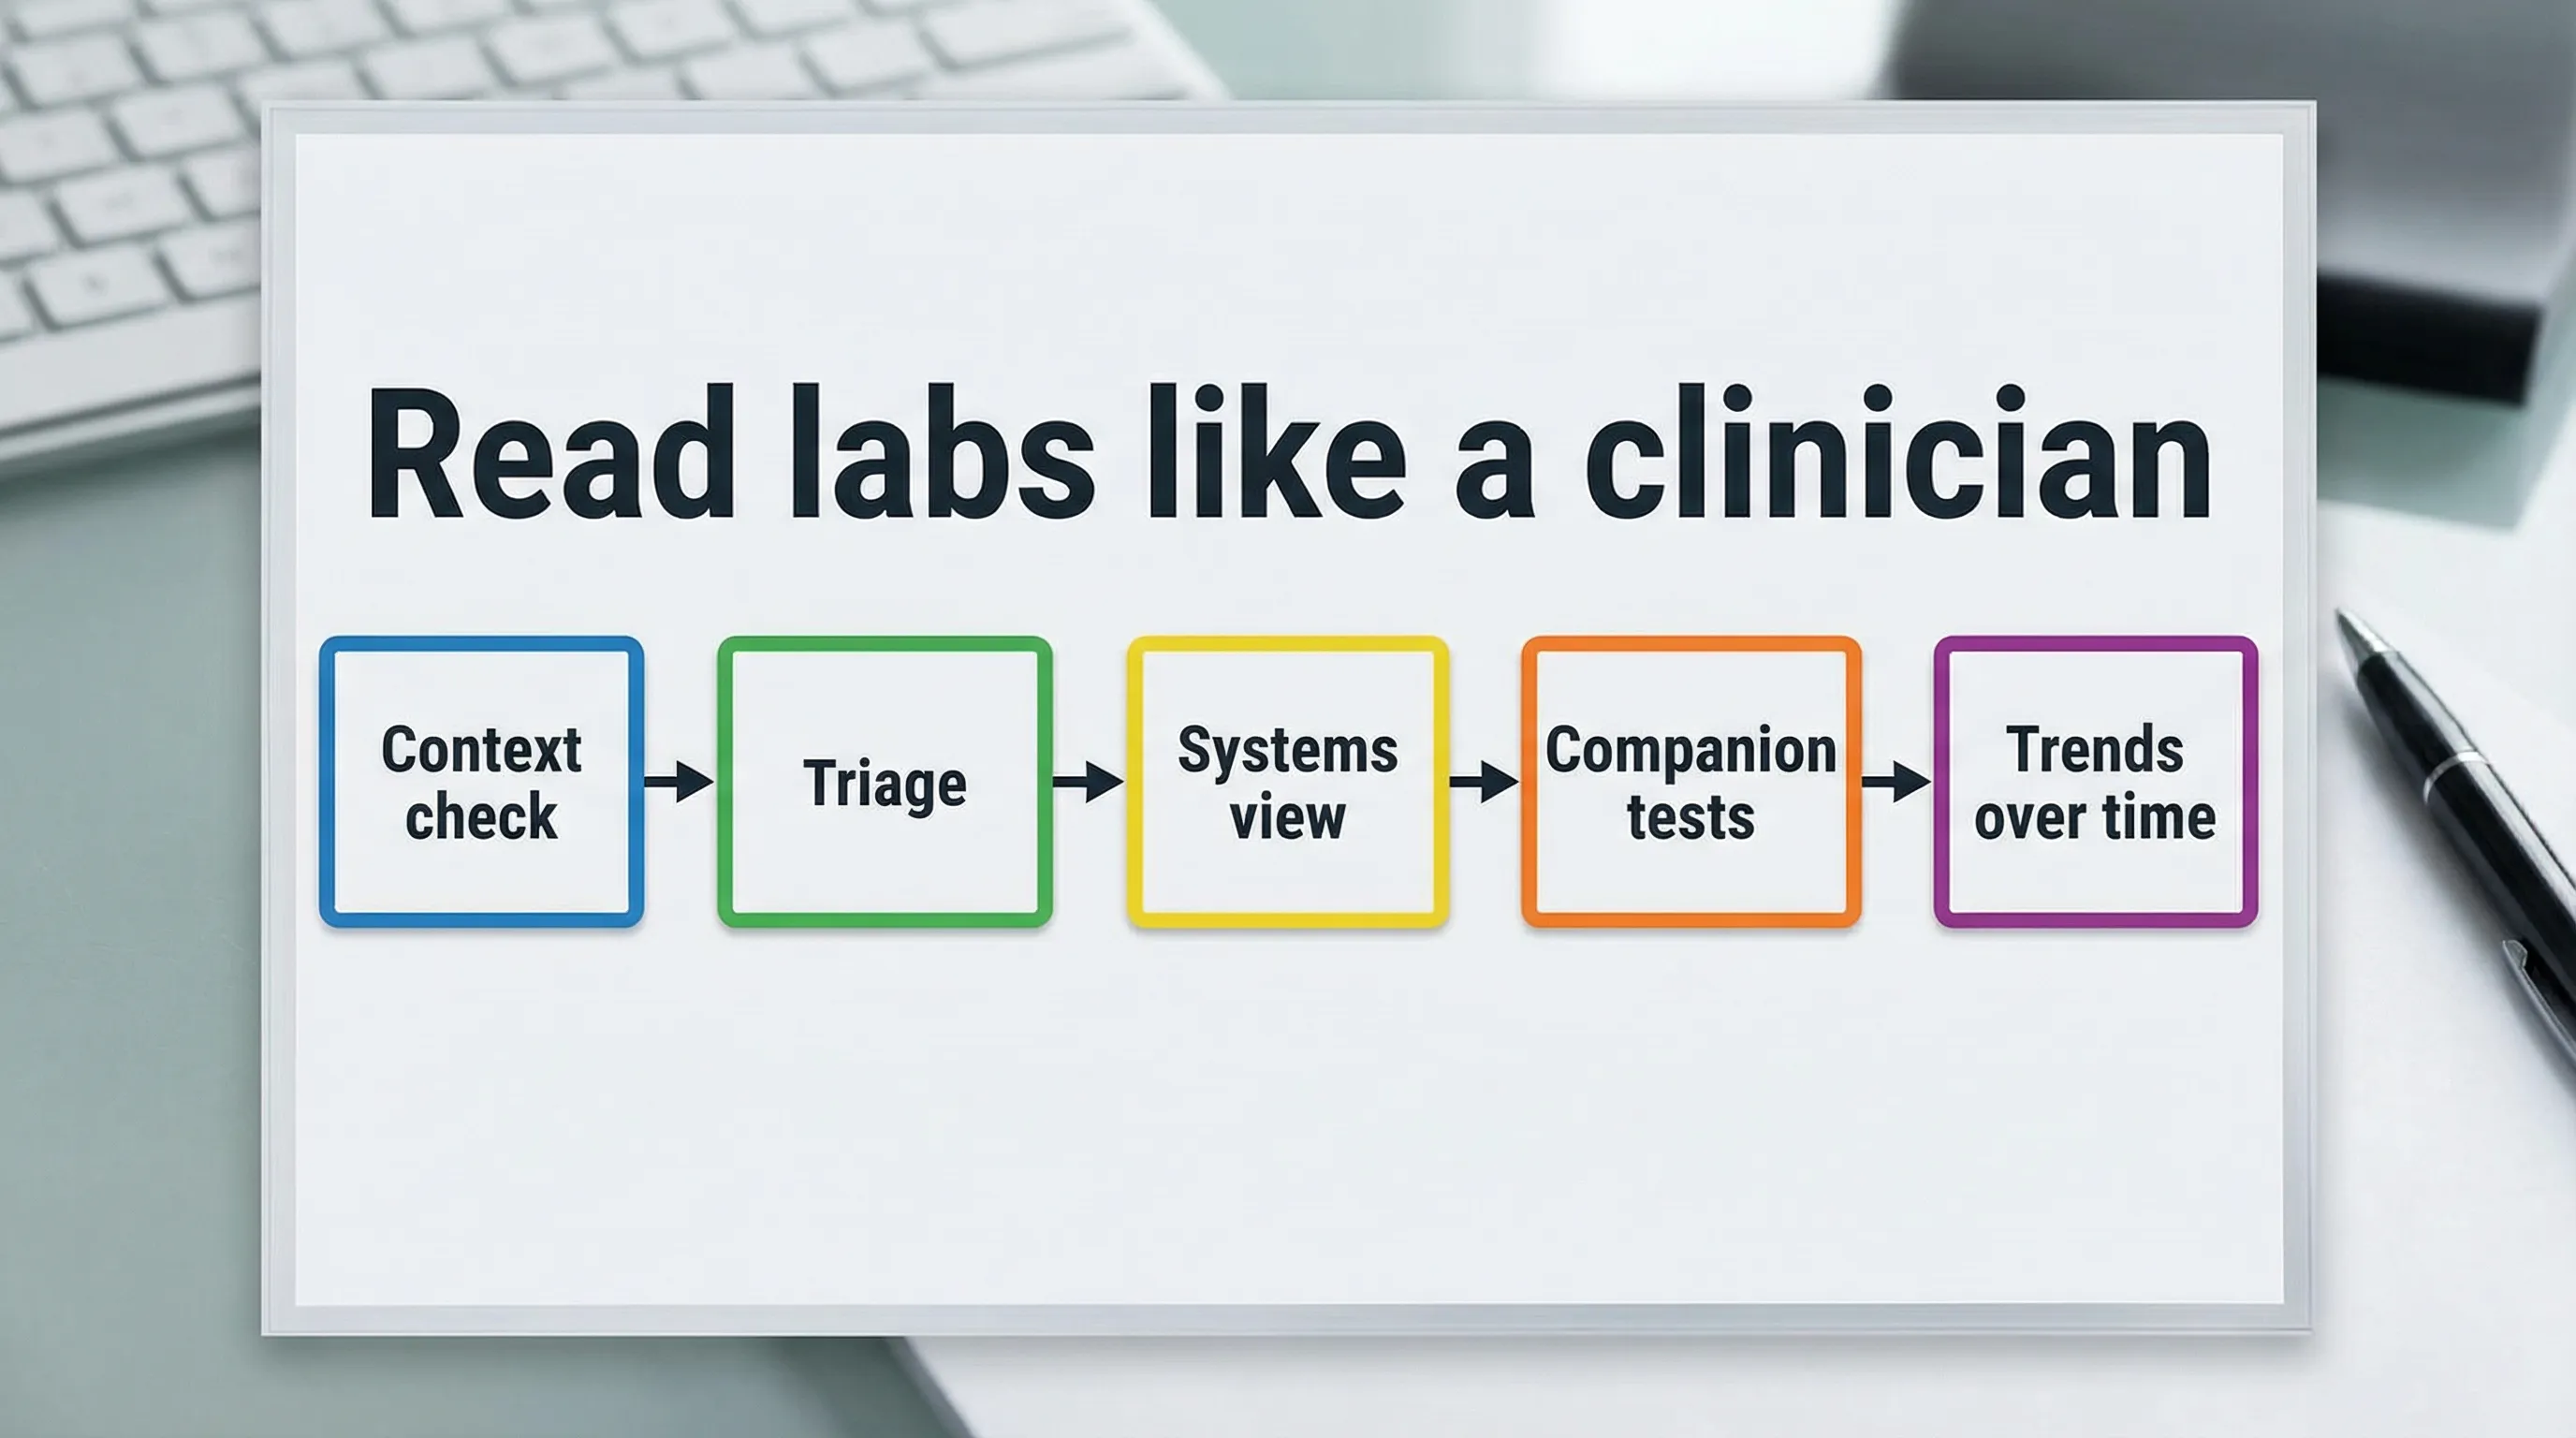
This article guides you through how to read blood test results like a clinician, moving beyond simple color-coded flags to understanding patterns and context in your lab report. It covers key biomarkers important for longevity and metabolic health, such as ApoB, hs-CRP, fasting insulin, and eGFR, and explains how to interpret these with clinical insights. Whether you want to optimize your health or need to make sense of "normal" results that don’t match how you feel, this post provides a clear framework for smarter lab reading.
Most people read a lab report like a scoreboard: green is good, red is bad. Clinicians read it like a story: context, patterns, and what to do next.
If you have ever been told “everything is normal” while you still feel exhausted, gaining weight, or struggling with performance, the gap is usually interpretation, not access. This guide will show you how to read blood test results like a clinician, including what the flags really mean, which biomarkers matter most for longevity (like ApoB, hs-CRP, fasting insulin, HOMA-IR, eGFR, ferritin, Lp(a)), and how to plan smart follow-ups.
Educational only, not medical advice. If you have severe symptoms, are pregnant, or your report includes “critical” values, seek urgent medical care.
First, know what you are actually looking at on a lab report
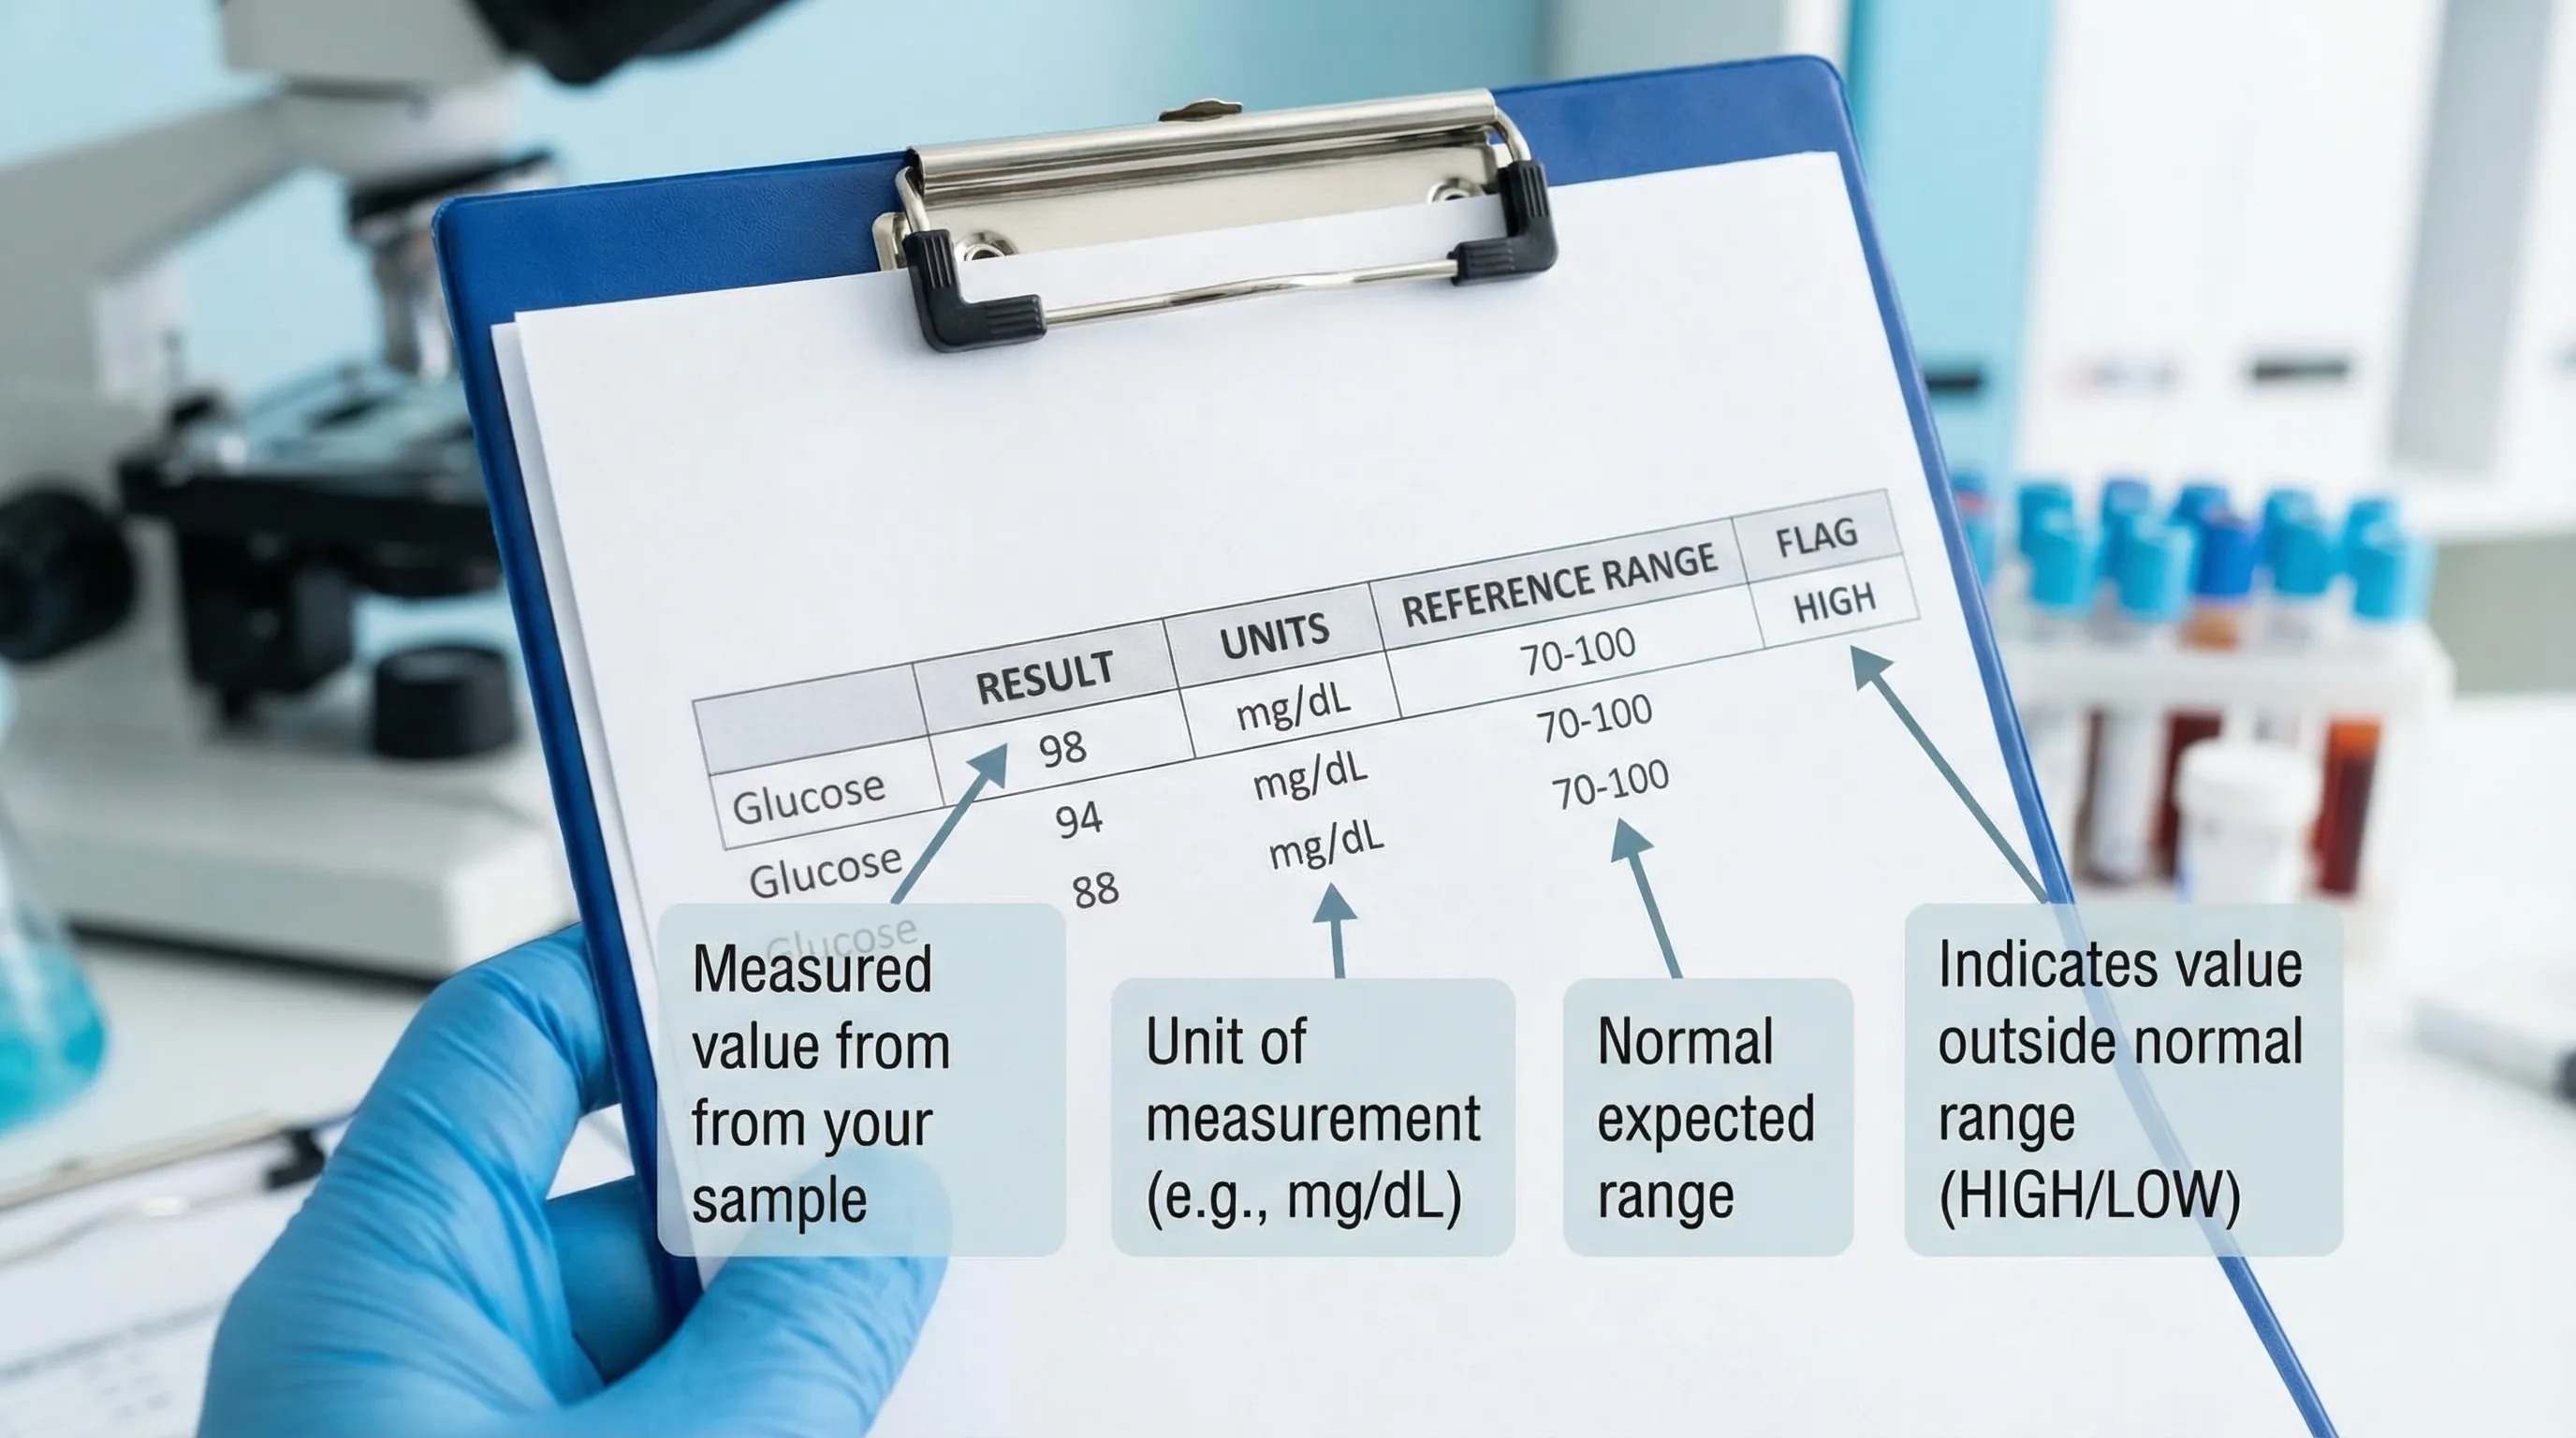
Most standard lab reports (Quest/Labcorp and others) include:
- Result: your measured value.
- Units: mg/dL, mmol/L, ng/mL, etc. Units matter.
- Reference range: the lab’s “normal” range based on their method and population.
- Flags: H (high), L (low), sometimes A (abnormal).
Why “normal range” is not the same as “optimal”
A reference range is typically built from a broad population that includes people with early disease, poor sleep, suboptimal diets, and metabolic dysfunction. Clinicians often use risk-based targets (especially for cardiometabolic markers) rather than “in-range = fine.”
Also, ranges vary between labs, and results can shift from:
- hydration status
- fasting duration
- time of day (cortisol, testosterone)
- recent exercise (CK, AST, creatinine)
- alcohol (GGT, triglycerides)
- illness/inflammation (hs-CRP, ferritin)
- supplements (biotin can interfere with some immunoassays)
Step 1: Do the clinician “quality check” before interpreting anything
Before you decide a marker is truly high or low, check the basics.
The five context questions clinicians ask
Were you fasting, and for how long? Fasting insulin, glucose, triglycerides, and some hormone markers can shift with inconsistent fasting.
What time was the draw? Cortisol and testosterone have strong diurnal patterns. A morning draw is often preferred for baseline comparison.
Did you exercise hard in the prior 24 to 48 hours? This can raise AST and sometimes creatinine, and can cause transient inflammation signals.
Were you sick recently (or vaccinated, or injured)? Acute inflammation can change hs-CRP, ferritin, WBCs, and more.
Any meds or supplements that affect labs? Thyroid meds, testosterone therapy, statins, GLP-1s, NSAIDs, creatine, and high-dose biotin are common examples.
If the context is “messy,” a clinician may treat the result as a data point, not a diagnosis, and schedule a retest under consistent conditions.
Step 2: Triage the report (clinician-style) into 3 buckets
Clinicians mentally sort labs into action categories.
Swipe
Important: most “H” and “L” flags are not emergencies. But if your report uses words like “critical,” labs generally attempt to call the ordering clinician because the result may require immediate attention.
Step 3: Read results by systems, not by single markers
A clinician rarely interprets one biomarker in isolation. They interpret systems.
System A: Cardiometabolic risk (where early problems hide)
If you care about longevity, this is usually the highest ROI section to understand.
Key markers and what clinicians use them for:
Swipe
Patterns clinicians pay attention to (more than “out of range”)
Pattern 1: Normal glucose, high fasting insulin This is a classic early insulin resistance pattern. Glucose can stay normal for years while insulin rises to compensate. Pair this with HOMA-IR, triglycerides, HDL, ALT/GGT, and waist circumference.
Pattern 2: LDL-C looks fine, ApoB is high LDL-C is cholesterol mass. ApoB approximates particle number, which is often more predictive in people with insulin resistance or high triglycerides. This is why many prevention-focused clinicians prioritize ApoB for risk stratification.
Pattern 3: ApoB high + hs-CRP high This combination suggests both atherogenic particle burden and inflammatory signaling. Clinicians typically ask about sleep, alcohol, smoking, visceral fat, periodontal disease, training load, and recent infection. (For inflammation background, see the CDC/AHA scientific statement on hs-CRP in CVD risk assessment in Circulation.)
System B: Liver function and metabolic strain
Liver markers can reflect alcohol exposure, fatty liver risk, medication effects, training load, and metabolic health.
Common markers:
- ALT, AST: can rise with liver stress, but AST can rise with muscle breakdown.
- GGT: often used as a more specific marker of hepatobiliary strain and oxidative stress; see GGT guide.
- Alkaline phosphatase (ALP): liver and bone turnover context; see ALP guide.
- Total bilirubin: can reflect multiple physiologic factors; see total bilirubin guide.
- Albumin: nutrition, inflammation, liver synthetic function context; see albumin guide.
Clinician pattern example: mild ALT elevation + high triglycerides + higher fasting insulin can suggest metabolic strain (often discussed in the context of fatty liver risk), especially if GGT is also elevated.
System C: Kidney filtration and hydration context
Kidney interpretation is a perfect example of “single marker vs story.”
Key markers:
- Creatinine (serum): influenced by muscle mass, creatine, hydration; see creatinine guide.
- eGFR: estimated filtration rate derived from creatinine (and sometimes other inputs); see eGFR guide.
- BUN/Creatinine ratio: hydration and renal perfusion context; see BUN/Cr ratio guide.
- Urine protein / urine albumin-to-creatinine ratio: early kidney and vascular risk signal; see urine protein guide and urine albumin guide.
Clinician pattern example: a strength-trained person can have a higher creatinine with a “lower” eGFR estimate even with healthy kidneys. That is why clinicians consider muscle mass, supplements, hydration, and urine markers rather than panicking over one number.
For general eGFR interpretation background, the National Kidney Foundation is a reliable reference.
System D: Blood counts, oxygen delivery, and iron dynamics
If fatigue or poor performance is part of the story, clinicians often zoom in here.
- Hemoglobin and hematocrit: oxygen delivery capacity; see hemoglobin and hematocrit.
- MCV, MCH, RDW: “shape and content” clues for anemia patterns; see MCH guide.
- Ferritin: iron storage and inflammation context; see ferritin guide.
- WBC and differential: immune activation and recovery; see WBC count.
Clinician pattern example: low-normal ferritin + high RDW + fatigue may trigger a deeper look at iron intake, absorption issues, menstrual loss (for women), and companion markers (serum iron, transferrin saturation, CRP).
System E: Thyroid and sex hormones (symptom-driven, timing-sensitive)
Hormone interpretation is where many people get dismissed because testing is too narrow.
Clinicians pay attention to:
- Thyroid: TSH plus free T4 (and sometimes free T3), with symptoms and medication context.
- Reproductive hormones: testosterone, estradiol, SHBG, LH/FSH, and timing.
- Stress hormones: cortisol (time-of-day matters); see cortisol guide.
Example: In men, interpreting estradiol is most meaningful when you know the method used and the broader context (testosterone, SHBG, symptoms). See Vitals Vault’s estradiol guide and FSH guide for deeper reads.
Step 4: Use “companion tests” to avoid wrong conclusions
A clinician often asks, “What else should be true if this is real?”
Swipe
Step 5: Track trends like a clinician (your second lab is often more valuable than your first)
One result is a snapshot. Clinicians care about:
- Direction: improving, stable, drifting.
- Rate of change: fast shifts are more concerning than slow movement.
- Consistency of conditions: same fasting window, similar training load, similar time-of-day.
A practical retest cadence for proactive adults
This is not a one-size-fits-all schedule, but common clinician logic looks like:
- Every 3 to 6 months: if you are actively changing weight, training, sleep, alcohol, or meds, and you want fast feedback (insulin resistance markers, ApoB, hs-CRP).
- Every 6 to 12 months: if stable and using labs for prevention and baseline tracking.
When you cannot get your doctor to order “the right tests”
Many readers land here after being told:
- “We do not test ApoB.”
- “Your LDL is fine, so we are done.”
- “You are in range.”
- “Insurance will not cover it.”
That is exactly why direct access testing exists.
With Vitals Vault, you can order comprehensive panels with no doctor referral needed, get results in 24 to 48 hours, and receive clinician-reviewed insights designed for preventive and longevity-focused decisions.
Explore what’s included: View biomarkers or check out panels.
Vitals Vault vs Function Health, InsideTracker, Superpower, and Mito Health
If you are comparing programs, focus on three things clinicians care about: biomarker depth, interpretation support, and friction (waitlists, referrals, hidden fees).
Swipe
If your goal is clinician-level interpretation with maximum biomarker coverage per dollar, Vitals Vault is built to be the comprehensive, affordable alternative.
CTA: Start with a full panel at Vitals Vault checkout or browse individual markers at Vitals Vault biomarkers.
Frequently Asked Questions
How do I read blood test results if everything is marked “normal” but I feel awful? “Normal” means you fall inside a reference range, not that your biomarkers are optimal for your symptoms or goals. Look for patterns (fasting insulin vs glucose, ApoB vs LDL-C, ferritin with CRP) and consider retesting under consistent conditions.
What is the difference between LDL-C and ApoB? LDL-C measures the cholesterol carried inside LDL particles. ApoB approximates the number of atherogenic particles (LDL, VLDL remnants, etc.). Some people can have “okay” LDL-C but a higher ApoB, especially with insulin resistance.
What does hs-CRP tell you on a blood test? hs-CRP is a high-sensitivity inflammation marker often used in cardiometabolic risk context. It can rise from chronic low-grade inflammation (visceral fat, poor sleep, smoking) or from short-term triggers like infection or intense training.
How do I calculate HOMA-IR from my labs? HOMA-IR is calculated from fasting glucose and fasting insulin. Because formulas vary by unit (mg/dL vs mmol/L), use a reliable calculator or have it computed in your report, then interpret it alongside triglycerides, HDL, and waist/visceral fat indicators.
Why does my eGFR look low if I lift weights? eGFR is estimated from creatinine, and creatinine is influenced by muscle mass, creatine use, and hydration. A clinician typically checks trends, urine albumin/protein, and repeat testing before assuming kidney disease.
Which blood tests are most important for longevity? Most clinicians prioritize cardiometabolic risk markers first: ApoB, fasting insulin (and HOMA-IR), HbA1c, triglycerides/HDL, hs-CRP, and kidney screening (eGFR and urine albumin). Hormones, nutrients, and advanced markers are then layered based on symptoms and goals.
Can I order blood tests without a doctor? Yes. With Vitals Vault you can order comprehensive biomarker testing with no doctor referral needed, draw at nationwide locations, and get clinician-reviewed insights.
Get clinician-reviewed lab insights without the referral runaround
If you want to stop guessing and start reading labs the way preventive clinicians do, the fastest path is comprehensive testing plus expert interpretation.
- Order 100 to 160+ biomarkers in one plan
- No waitlist
- No doctor referral needed
- Results in 24 to 48 hours (typical)
- Clinician-reviewed insights and actionable next steps
Browse markers: https://www.vitalsvault.com/biomarkers
Order now: https://www.vitalsvault.com/checkout
Conclusion
Interpreting blood test results like a clinician involves checking context, triaging urgency, and understanding system-wide patterns rather than isolated values. Key biomarkers reveal insights about cardiometabolic risk, liver and kidney function, blood counts, and hormones that can guide follow-up actions. By approaching labs with this methodical perspective and tracking trends over time, you can make more informed decisions about your health and wellness. Consider applying these principles to better understand your next set of test results.